Free Access
Fig. 2
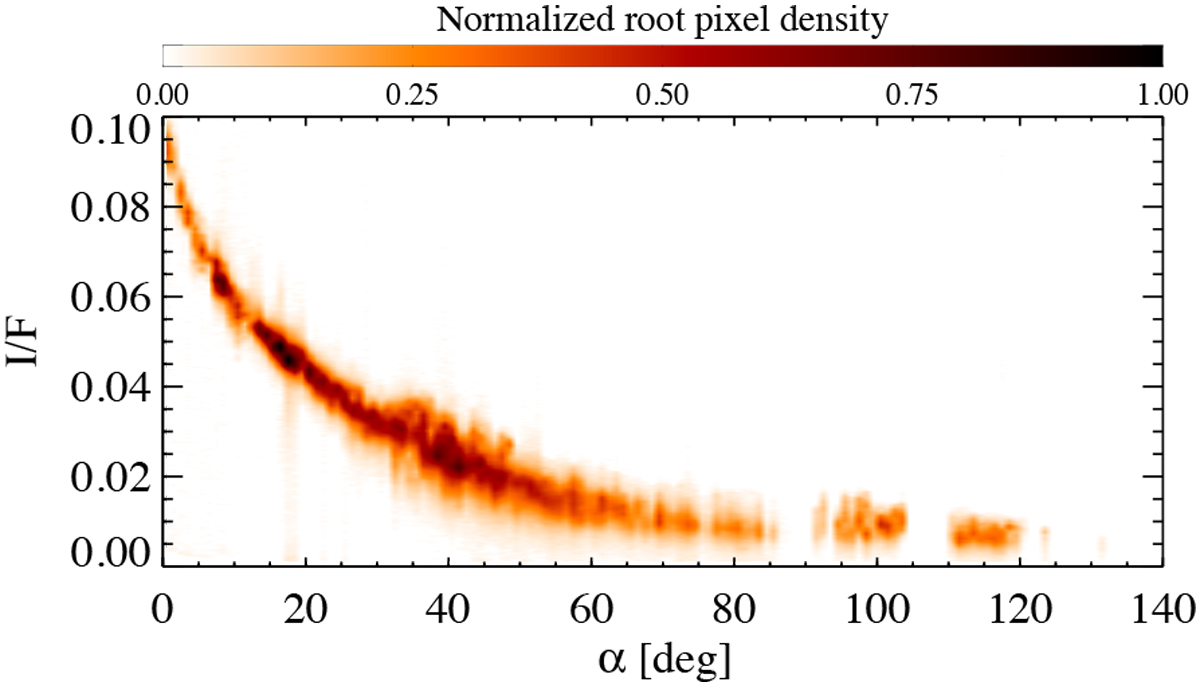
I∕F at 0.55 μm as a function of the phase angle: the contour plot shows the square root of the point density normalized to its maximum value. Data are from Approach Phase, RC3, Transfer to Survey, Survey, and OE observations.
Current usage metrics show cumulative count of Article Views (full-text article views including HTML views, PDF and ePub downloads, according to the available data) and Abstracts Views on Vision4Press platform.
Data correspond to usage on the plateform after 2015. The current usage metrics is available 48-96 hours after online publication and is updated daily on week days.
Initial download of the metrics may take a while.