Fig. 3
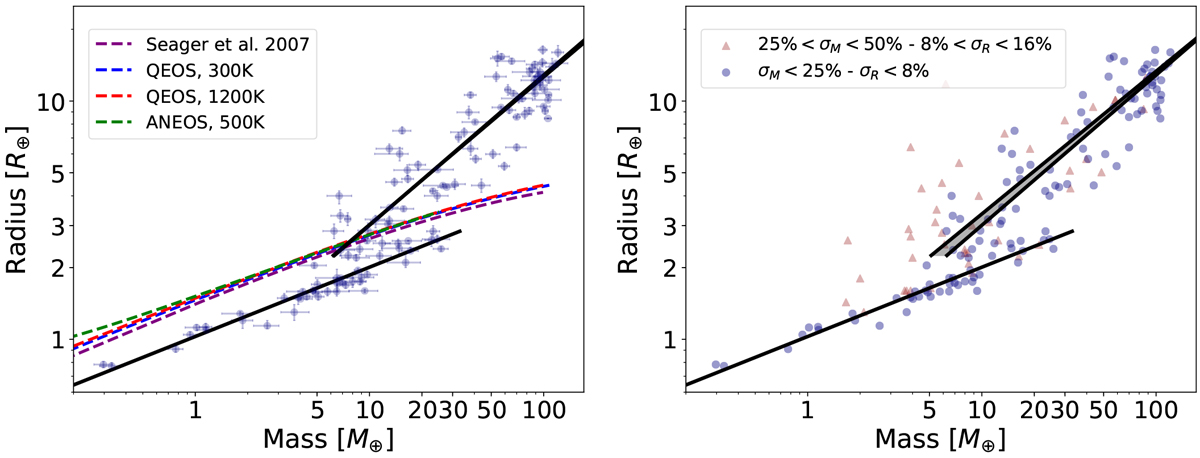
Left: M-R diagram comparing obtained M-R relations when using different EOS for water: the polytropic EOS of Seager et al. (2007) (brown), QEOS assuming temperatures of 300 and 1200 K (More et al. 1988), and ANEOS (Thompson 1990) with a surface temperature of 500 K. Right: M-R diagram comparing obtained M-R relations when using different cuts for the mass and radius uncertainties when building the revisited catalogue: σM ∕M = 25% and σR ∕R = 8%, and σM ∕M = 50% and σR ∕R = 16%. The grey envelope corresponds to the difference between the two. Blue circles represent the exoplanets with σM ∕M = 25% and σR ∕R = 8%, and red triangles represent the planets with uncertainties between σM∕M = 25% and σR ∕R = 8%, and σM ∕M = 50% and σR ∕R = 16%.
Current usage metrics show cumulative count of Article Views (full-text article views including HTML views, PDF and ePub downloads, according to the available data) and Abstracts Views on Vision4Press platform.
Data correspond to usage on the plateform after 2015. The current usage metrics is available 48-96 hours after online publication and is updated daily on week days.
Initial download of the metrics may take a while.