Fig. 2
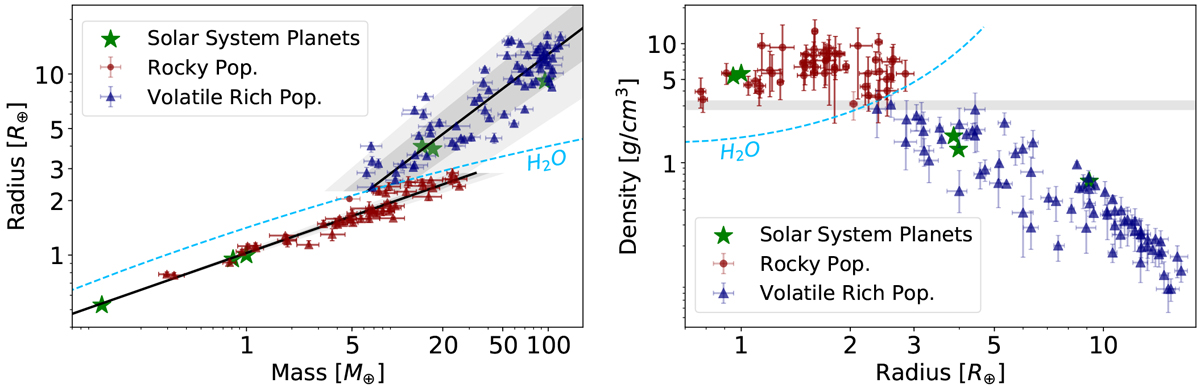
Left: M-R relations fitting rocky and volatile-rich populations. Dotted line corresponds the composition line of pure water using QEOS for a temperature of 300 K (More et al. 1988). The grey and light-grey envelopes represent the ± 1σ and ± 2σ regions of the fit. Right: density against radius for our catalogue. Rocky and the volatile-rich populations are separated by the composition line of pure water (Dorn et al. 2015). The grey envelope indicates the region between 2.8 and 3.3 g cm−3.
Current usage metrics show cumulative count of Article Views (full-text article views including HTML views, PDF and ePub downloads, according to the available data) and Abstracts Views on Vision4Press platform.
Data correspond to usage on the plateform after 2015. The current usage metrics is available 48-96 hours after online publication and is updated daily on week days.
Initial download of the metrics may take a while.