Fig. 1
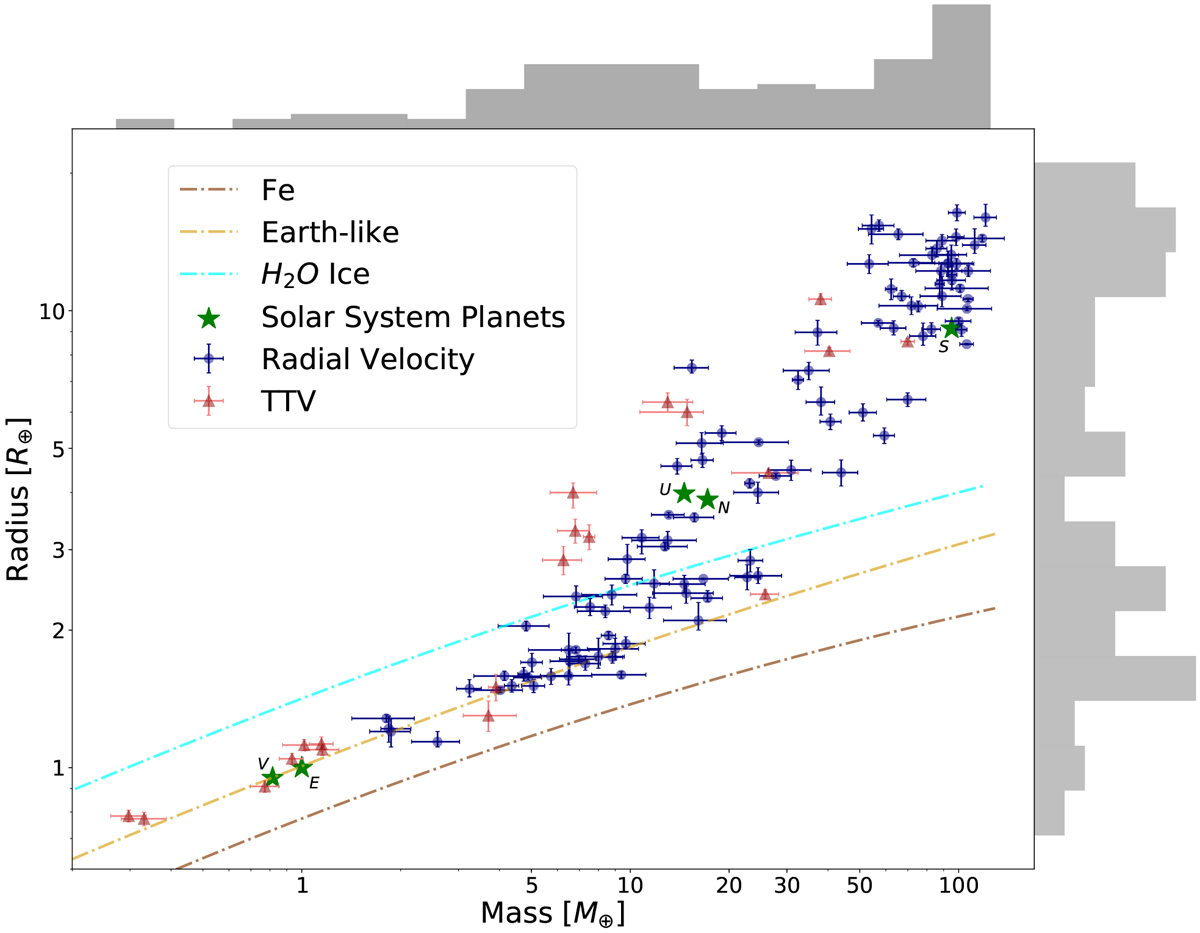
Revisited M-R diagram after applying our criteria to keep reliable and robust mass measurements with relative uncertainties smaller than 25% for mass and smaller than 8% for radius. The red triangles and blue circles correspond to data with mass determination from TTVs and RVs, respectively. We also display the composition lines of pure-iron (brown), Earth-like planets (light-brown) and water ice (blue) (Dorn et al. 2015). We also plot the contour lines and the distribution of exoplanet mass (top) and radius (right) of our sample.
Current usage metrics show cumulative count of Article Views (full-text article views including HTML views, PDF and ePub downloads, according to the available data) and Abstracts Views on Vision4Press platform.
Data correspond to usage on the plateform after 2015. The current usage metrics is available 48-96 hours after online publication and is updated daily on week days.
Initial download of the metrics may take a while.