Fig. 8.
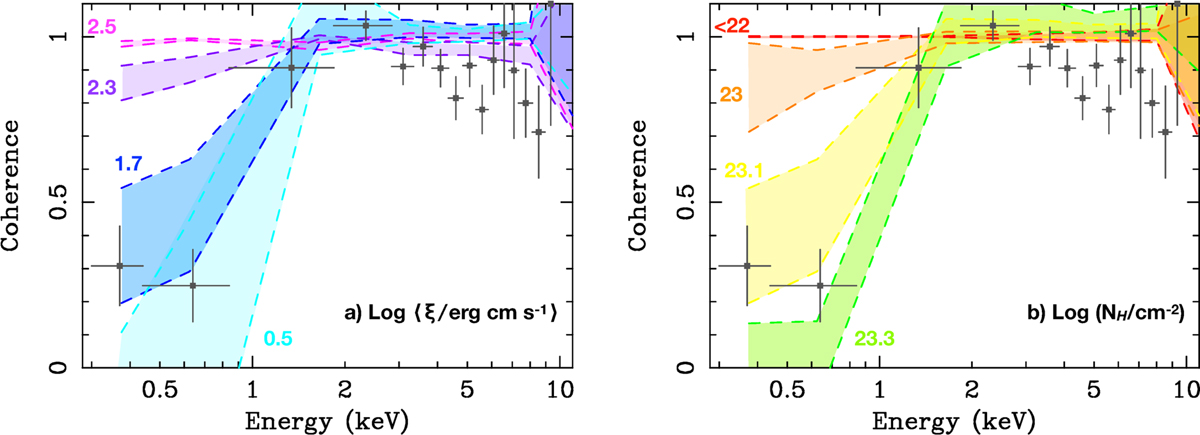
Simulated coherence spectra for an obscuring gas responding to variations of the ionising continuum. Panel a: dependency of the intensity of the drop of coherence on the average ionisation parameter: the colours indicate different degrees of ionisation of the gas, with log ξ varying within the ranges log ξ = 0.33 − 0.61 (cyan), log ξ = 1.53 − 1.82 (blue), log ξ = 2.14 − 2.42 (purple), log ξ = 2.33 − 2.61 (magenta). These respectively correspond to distances of d = 40, 10, 5, and 4 light days of the gas from the X-ray source. Panel b: dependency of the intensity of the drop of coherence caused by variations of the ionisation parameter (within the range log ξ = 1.53 − 1.82), on the average column density of the obscurer: the different values of column density are obtained by changing the depth of the gas, Δd = 3.8 × 1012 cm (red), 3.8 × 1013 cm (orange), 4.8 × 1013 cm (yellow), and 7.7 × 1013 cm (green). For comparison with the observations, the measured coherence during O1-O2 is overplotted (grey squares) on the simulated coherence spectra.
Current usage metrics show cumulative count of Article Views (full-text article views including HTML views, PDF and ePub downloads, according to the available data) and Abstracts Views on Vision4Press platform.
Data correspond to usage on the plateform after 2015. The current usage metrics is available 48-96 hours after online publication and is updated daily on week days.
Initial download of the metrics may take a while.