Fig. 6.
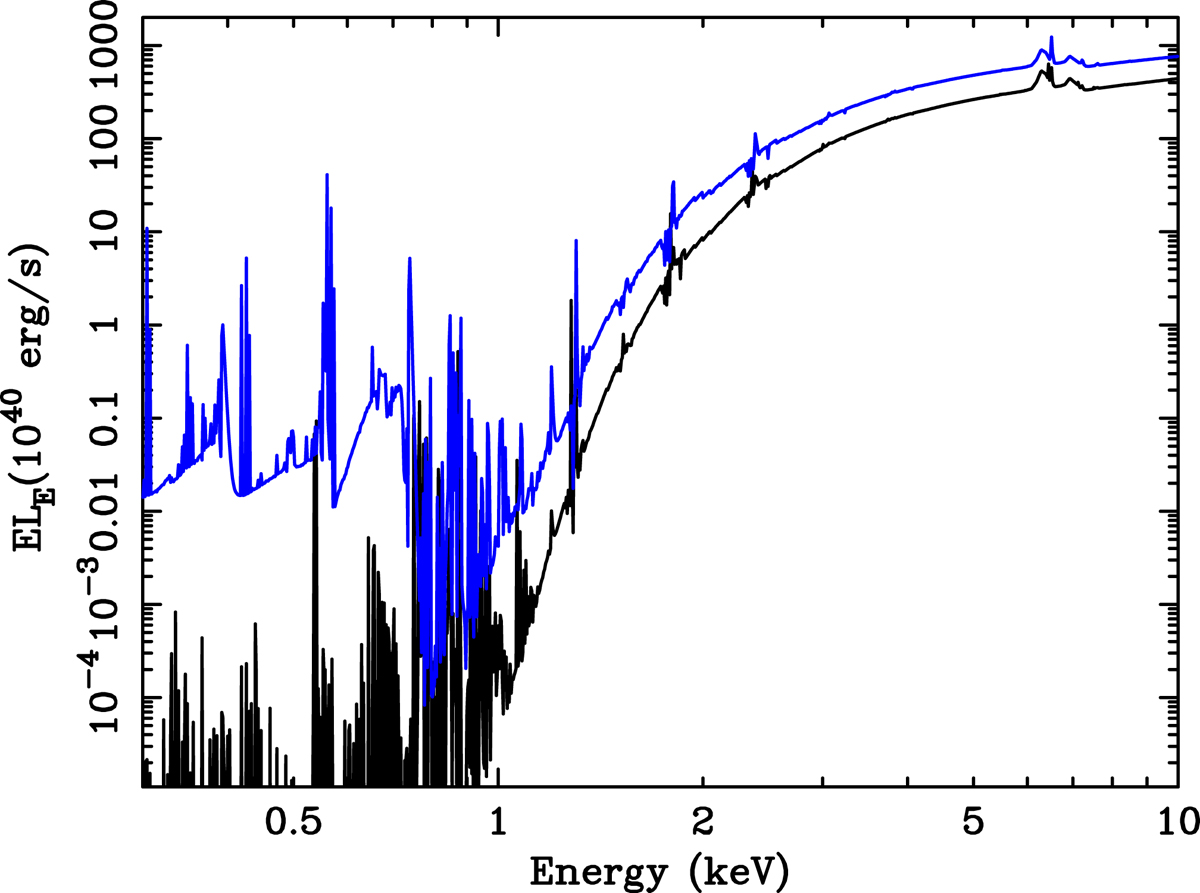
Examples of two Cloudy synthetic spectra showing the transmitted plus scattered emission from an obscuring gas, responding to the observed variations of X-ray continuum. The two spectra are from the two time bins during observations O1 (black) and O2 (blue), respectively corresponding to the lowest and highest input ionising luminosity. These spectra do not include the contribution of the constant scattered emission component produced by distant material.
Current usage metrics show cumulative count of Article Views (full-text article views including HTML views, PDF and ePub downloads, according to the available data) and Abstracts Views on Vision4Press platform.
Data correspond to usage on the plateform after 2015. The current usage metrics is available 48-96 hours after online publication and is updated daily on week days.
Initial download of the metrics may take a while.