Fig. 5.
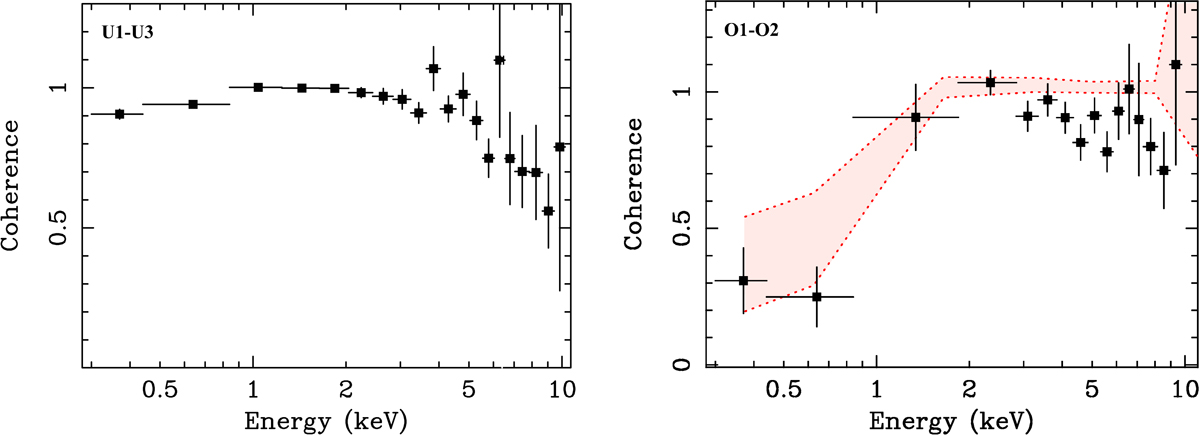
Coherence as a function of energy (U1-U3 left panel; O1-O2 right panel) over the frequency range 2.78 × 10⁻⁵ − 3.3 × 10⁻⁴ Hz, and with the 0.3 − 10 keV band as the reference band. Red shaded area in the right panel marks the 90% confidence level contours obtained from Cloudy simulations of an obscuring gas located at a distance of 10 light days, of electron density ne = 2.6 × 109 cm−3, and log NH = 23.1, responding to the observed variations of the ionising continuum on timescales τrec < 1500 s. The ionisation parameter of the simulated obscuring gas varies within the range log ξ = 1.53 − 1.82 as a consequence of short timescale variations of the ionising continuum.
Current usage metrics show cumulative count of Article Views (full-text article views including HTML views, PDF and ePub downloads, according to the available data) and Abstracts Views on Vision4Press platform.
Data correspond to usage on the plateform after 2015. The current usage metrics is available 48-96 hours after online publication and is updated daily on week days.
Initial download of the metrics may take a while.