Fig. 4.
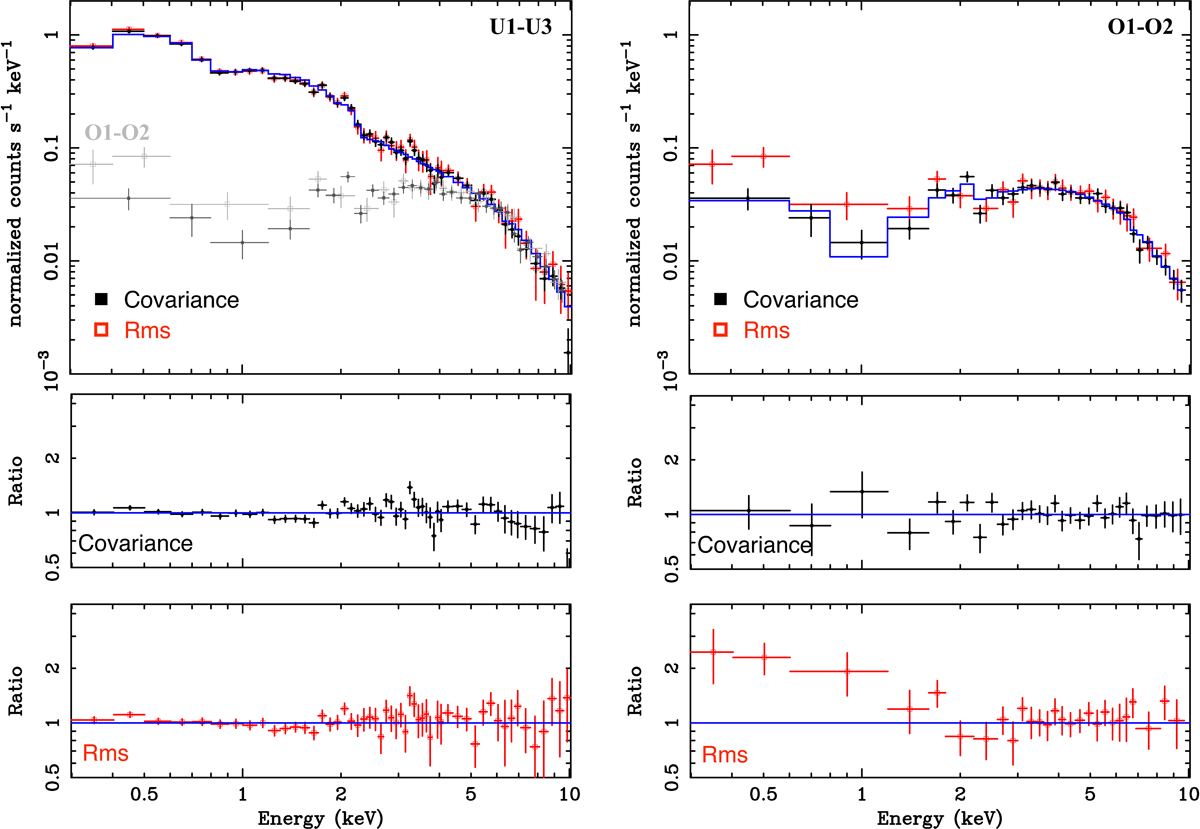
rms and covariance spectra of U1-U3 (left panels) and O1-O2 (right panels). Blue curve is the best-fit model to the covariance spectrum. rms and covariance spectra of O1-O2 are also overplotted on those of observations U1-U3 (left panel, grey squares) for an easier comparison. The bottom panels show the ratio of rms and covariance spectra to the best-fit model of the covariance spectrum.
Current usage metrics show cumulative count of Article Views (full-text article views including HTML views, PDF and ePub downloads, according to the available data) and Abstracts Views on Vision4Press platform.
Data correspond to usage on the plateform after 2015. The current usage metrics is available 48-96 hours after online publication and is updated daily on week days.
Initial download of the metrics may take a while.