Fig. 3.
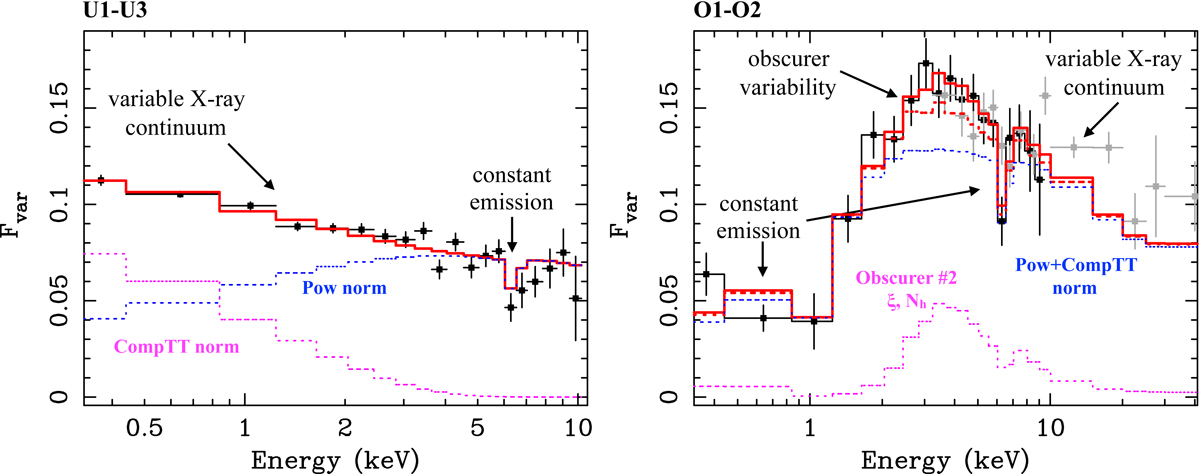
Fvar spectra of observations U1-U3 (left panel) and O1-O2 (right panel). Black and grey squares refer, respectively, to XMM-Newton and NuSTAR data. Blue and magenta dashed curves show Fvar models obtained by letting different parameters (as indicated in the labels) of the continuum or of obscurer #2 vary, while red solid curves are obtained by letting all those parameters vary simultaneously. Red dashed curve in the right panel shows the simple model obtained assuming only variations of the primary continuum and correlated variations of the ionisation parameter of obscurer #2. The main spectral features contributing to the shape of the Fvar spectra at different energies are schematically indicated by arrows in the plots.
Current usage metrics show cumulative count of Article Views (full-text article views including HTML views, PDF and ePub downloads, according to the available data) and Abstracts Views on Vision4Press platform.
Data correspond to usage on the plateform after 2015. The current usage metrics is available 48-96 hours after online publication and is updated daily on week days.
Initial download of the metrics may take a while.