Fig. 1.
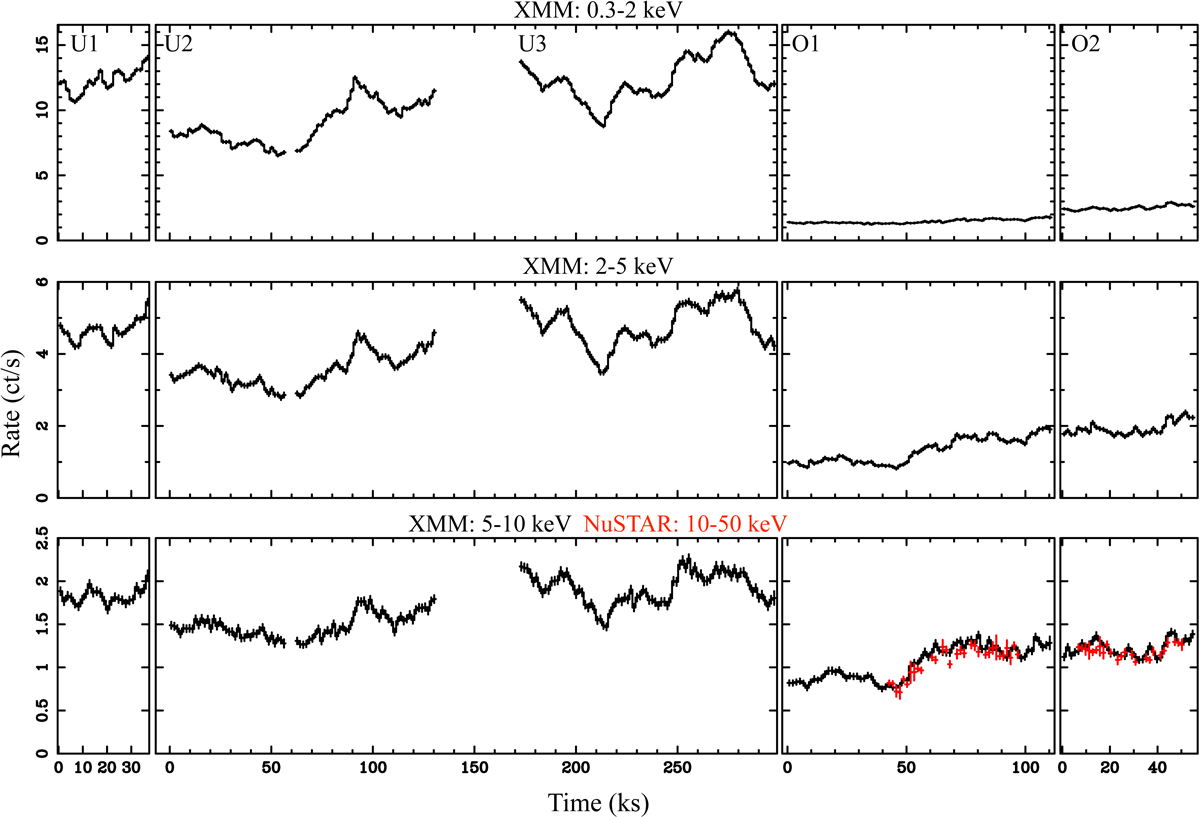
Background-subtracted light curves of NGC 3783. The XMM-Newton light curves are extracted in the 0.3 − 2 keV, 2 − 5 keV, and 5 − 10 keV energy bands (black curves in upper, middle, and lower panels, respectively). The NuSTAR light curves are extracted in the 10 − 50 keV energy band (red curves in the right-most lower panels). Note that in order to enable an easier comparison of the variability patterns in the XMM-Newton 5 − 10 keV and NuSTAR 10 − 50 keV light curves, the NuSTAR light curves were not rescaled for the extraction area; thus, the match with XMM-Newton is coincidental.
Current usage metrics show cumulative count of Article Views (full-text article views including HTML views, PDF and ePub downloads, according to the available data) and Abstracts Views on Vision4Press platform.
Data correspond to usage on the plateform after 2015. The current usage metrics is available 48-96 hours after online publication and is updated daily on week days.
Initial download of the metrics may take a while.