Fig. 4
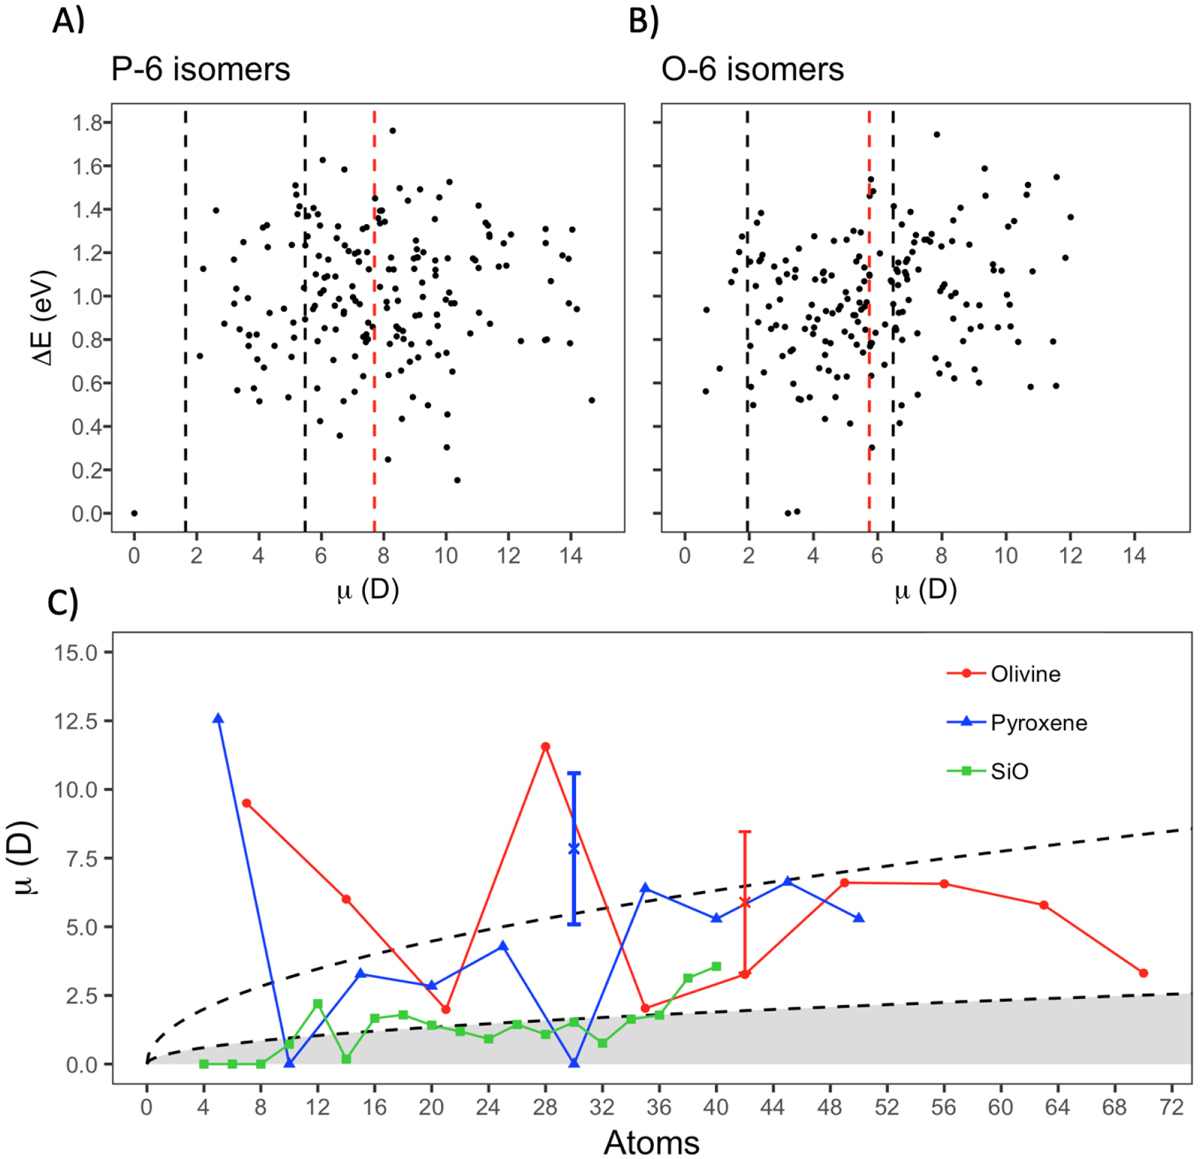
Top: values of μ (Debye) against relative energy (eV) of nanocluster isomer with respect to the lowest energy structure for P-6 isomers (A) and O-6 isomers (B). In each plot, the black dashed lines indicate the lowest and highest previously estimated dipole moments for nanosilicates (Hoang et al. 2016), while the red dashed lines mark the median value calculated for each data set. (C) Dipole moments μ for O-N (red circles), P-N (blue triangles) and SiO-N (green squares) nanoclusters with respect to the number of atoms Natoms. The blue and red crosses correspond to the average dipole μ values for the P-6 and O-6 isomer shown in (A) and (B) with the error bars indicating the variance in μ values for each set. The grey shaded area corresponds to the region where the dipole moment is too small for nanosilicates to contribute substantially to the AME. The two dashed lines correspond to the limits in (A) and (B).
Current usage metrics show cumulative count of Article Views (full-text article views including HTML views, PDF and ePub downloads, according to the available data) and Abstracts Views on Vision4Press platform.
Data correspond to usage on the plateform after 2015. The current usage metrics is available 48-96 hours after online publication and is updated daily on week days.
Initial download of the metrics may take a while.