Fig. 1
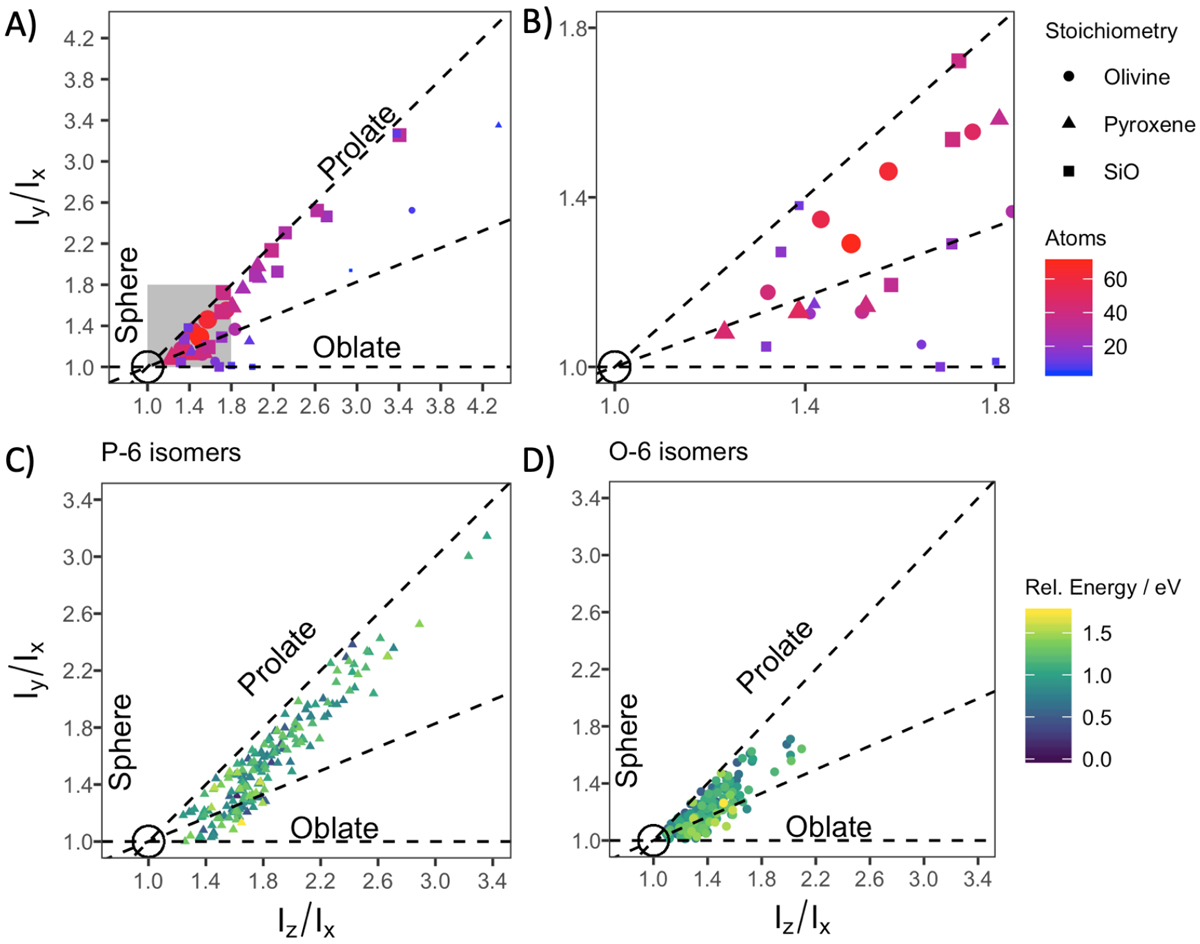
Ratio between the largest and smallest moment of inertia (Iz/Ix) with respect to the ratio between the intermediate moment of inertia to the smallest one (Iy /Ix) for three selected sets of nanoclusters. The black circle indicates the ratio that defines a perfect sphere (Iy /Ix = Iz /Ix = 1), while the dashed lines show the prolate (Iz = Iy > Ix) and oblate (Ix = Iy < Iz) limits. (A) Lowest energy O-N and P-N nanoclustersfor N = 1–10 and SiO-N nanoclustersfor N = 1–20, grey area corresponds to the plotted area in (B). (B) Zoom of the plot in (A) over a 1.0–1.8 range for both axes. (C) 180 P-6 nanocluster isomers. (D) 180 O-6 nanocluster isomers.
Current usage metrics show cumulative count of Article Views (full-text article views including HTML views, PDF and ePub downloads, according to the available data) and Abstracts Views on Vision4Press platform.
Data correspond to usage on the plateform after 2015. The current usage metrics is available 48-96 hours after online publication and is updated daily on week days.
Initial download of the metrics may take a while.