Fig. 6
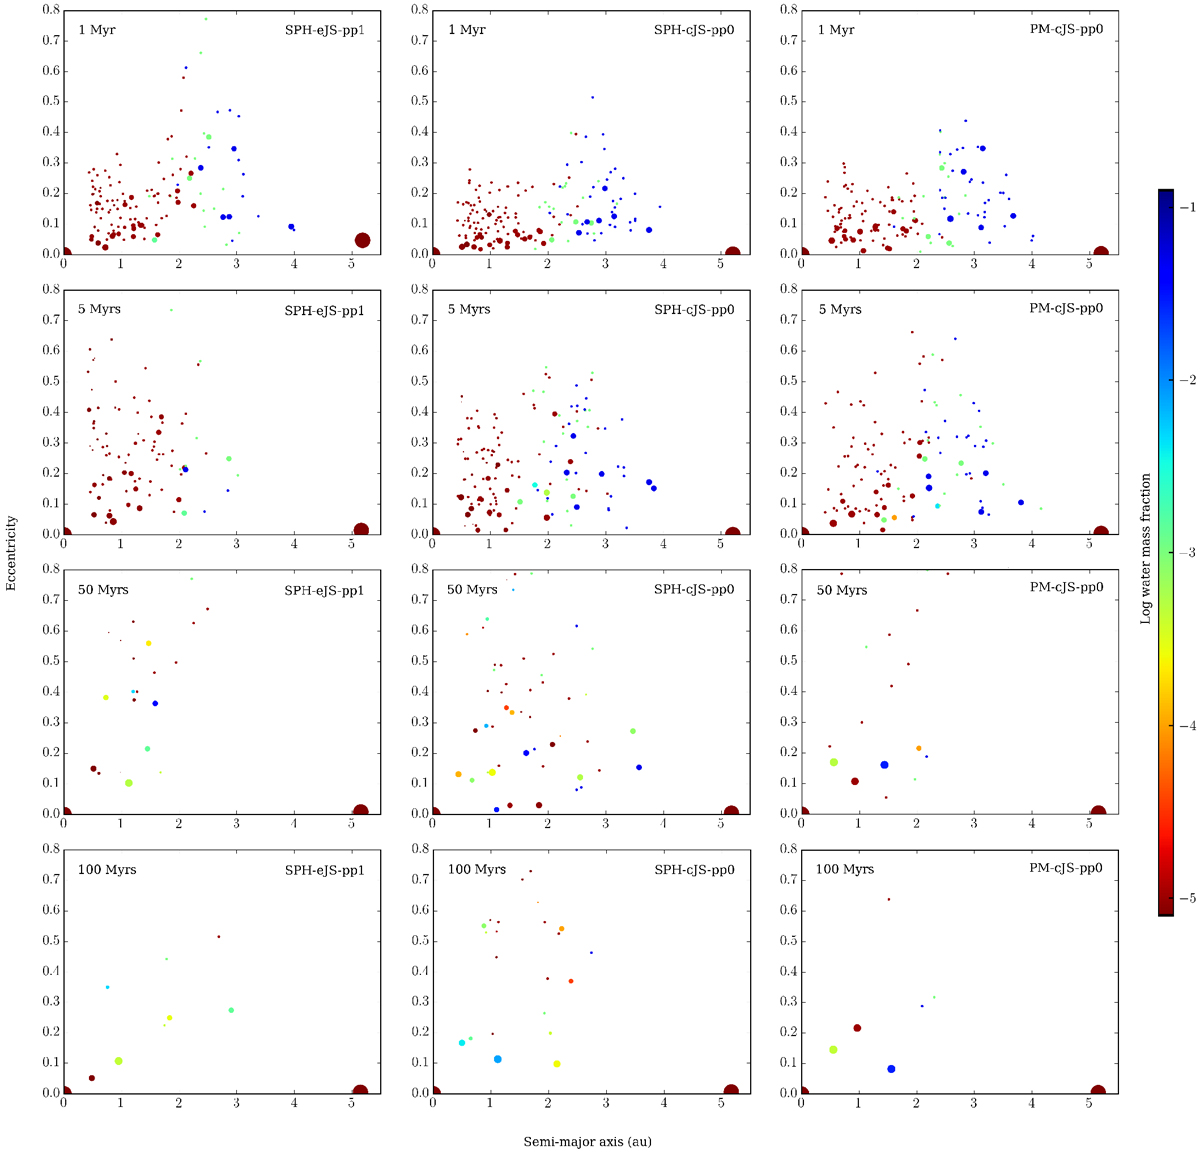
Simulation snapshots in the a–e plane for three different runs (columns). Typical evolution with eJS in the left column (SPH15-eJS-pp1) vs. cJS in the middle (SPH06-cJS-pp0) vs. cJS with PM on the right (PM06-cJS-pp0). Symbol sizes are proportional to mass1∕3. Each row represents an equal time in all scenarios: up to 1 Myr the evolution appears similar, except some more dynamical excitation with eJS (left). Within only ~5 Myr however, the great majority of water-rich material is removed with eJS, but remains in the system with cJS and starts to diffuse inwards. At 50 Myr, accretion is still actively ongoing with the SPH collision model (even though less so with eJS in this particular scenario), while with PM (right) it is almost over, except for some remaining planetesimals. We note that the cJS scenarios (middle and right columns) are pp0 runs, where some more leftover planetesimals are common. After ~100 Myr, body numbers are declining in the SPH scenarios (left and middle columns), but accretion and associated collisional evolution is still not over. We also note the damping effect on the eccentricity of the giant planet with eJS, consistent with similar studies (e.g., O’Brien et al. 2006). These scenarios represent typical behavior and were not specifically selected, except that the left and middle runs are those where the potentially habitable planets in Figs. 18 and 17 form.
Current usage metrics show cumulative count of Article Views (full-text article views including HTML views, PDF and ePub downloads, according to the available data) and Abstracts Views on Vision4Press platform.
Data correspond to usage on the plateform after 2015. The current usage metrics is available 48-96 hours after online publication and is updated daily on week days.
Initial download of the metrics may take a while.