Fig. 3
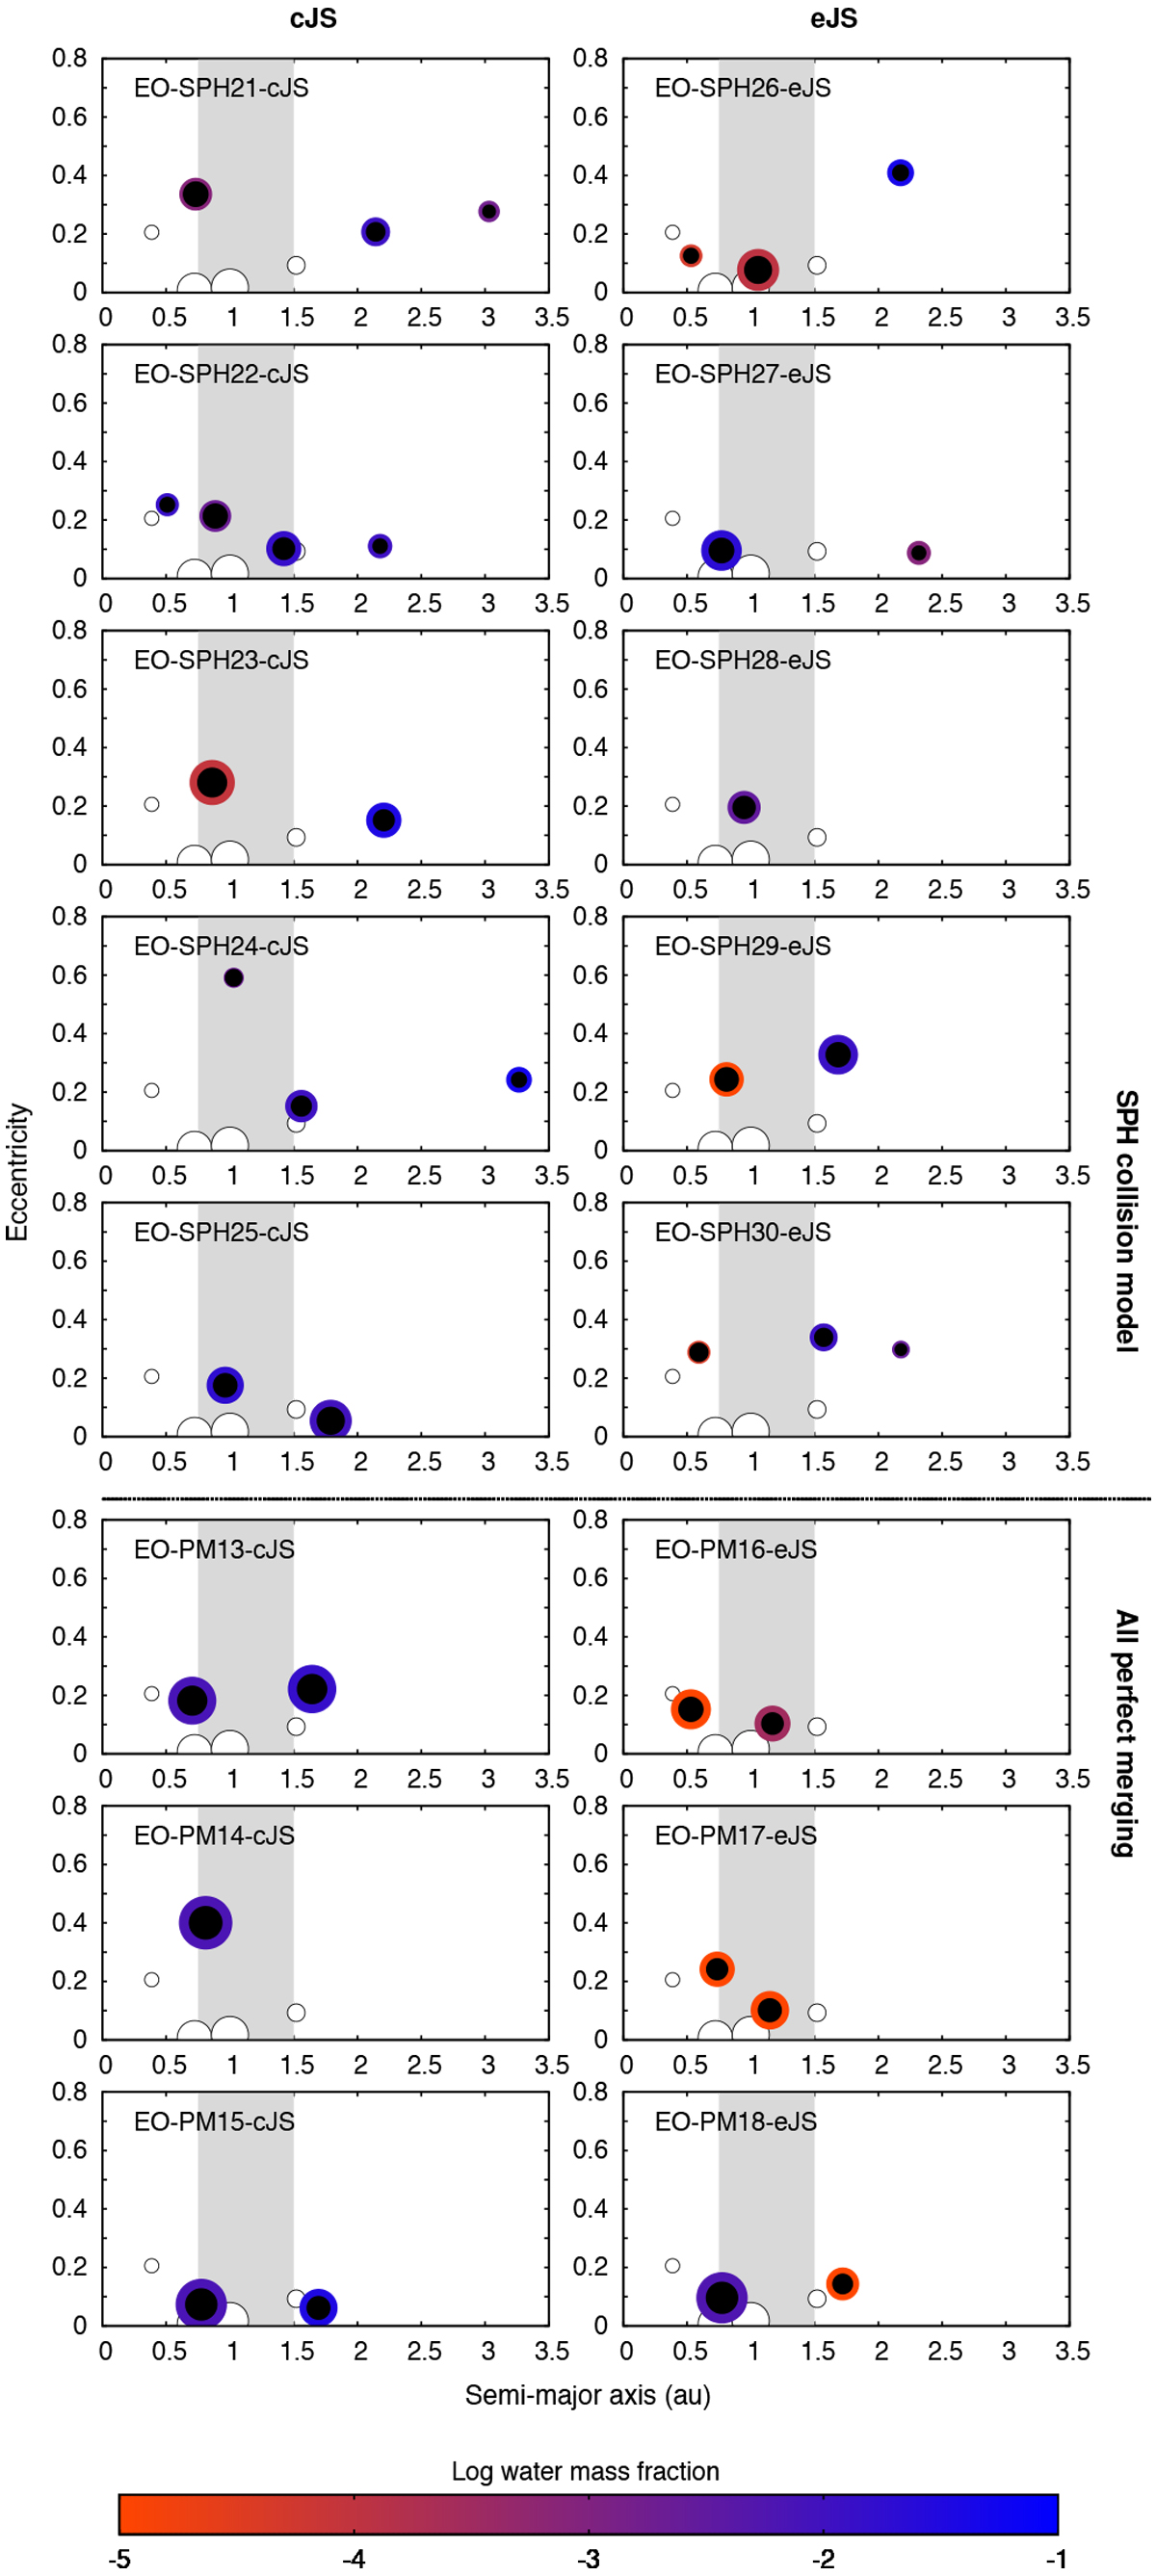
Final systems for all embryo-only scenarios (cf. Table 1). The columns represent cJS and eJS architectures, while planetesimal–planetesimal interactions are always included (pp1). Upper five rows: results based on the SPH collision model, lower three: from PM comparison runs. Colors, symbols, and their sizes have the same meanings as in Fig. 2.
Current usage metrics show cumulative count of Article Views (full-text article views including HTML views, PDF and ePub downloads, according to the available data) and Abstracts Views on Vision4Press platform.
Data correspond to usage on the plateform after 2015. The current usage metrics is available 48-96 hours after online publication and is updated daily on week days.
Initial download of the metrics may take a while.