Fig. 22
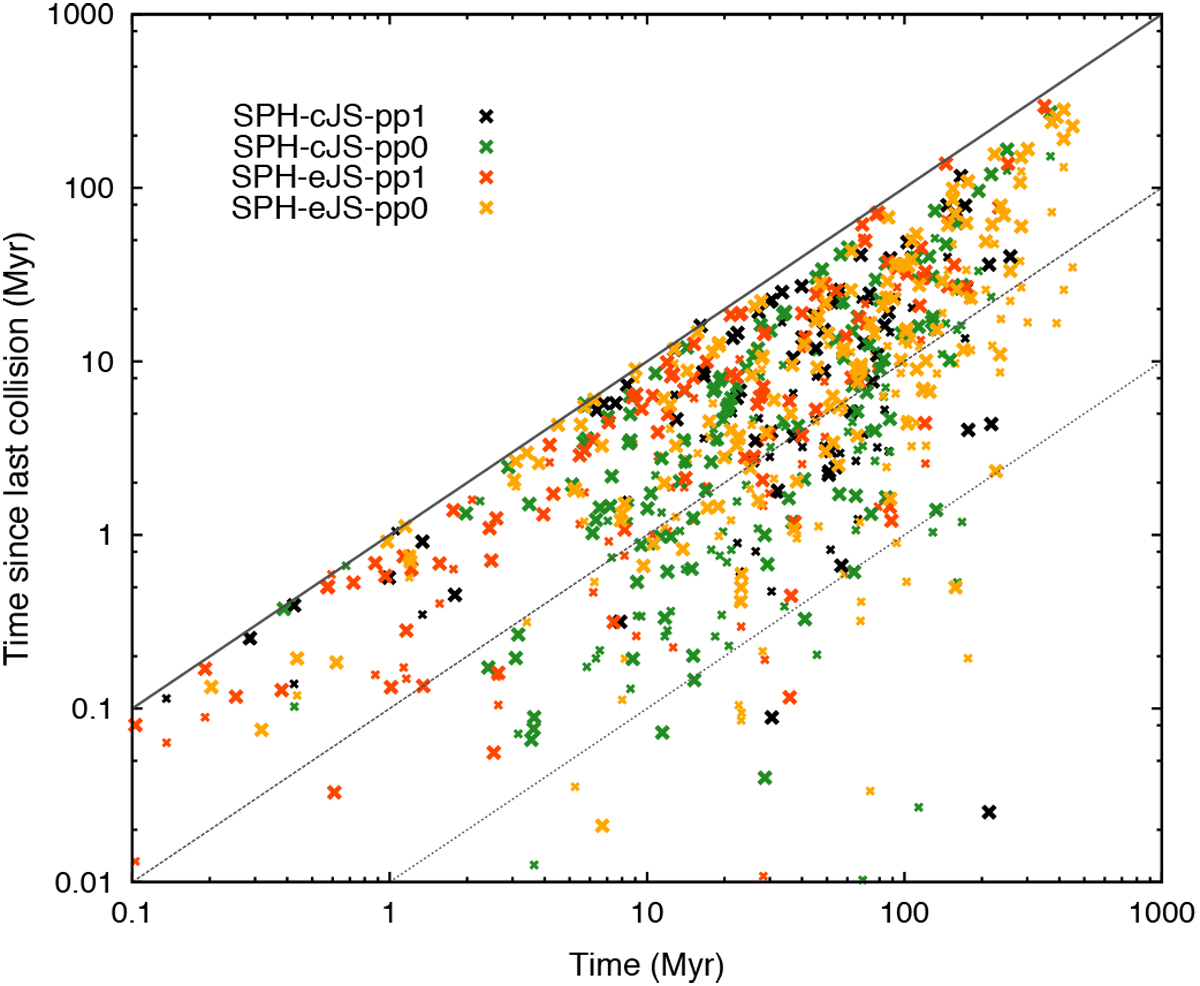
Time since the last collision (evaluated each time a collision happens) from the perspective of a growing planet as a function of time, for all 18 potentially habitable planets in the regular scenarios with our model. Small crosses count all collisions, large ones only impacts by embryos and protoplanets (i.e., excluding planetesimals). Each collision is assigned two data points in general – a small and a large cross – and if the last impacting body was an embryo or protoplanet then they coincide. The continuous and dashed lines indicate elapsed time (since the last collision): since simulation start (upper line), 1/10 of that time (middle line), and 1/100 of that time (lower line).
Current usage metrics show cumulative count of Article Views (full-text article views including HTML views, PDF and ePub downloads, according to the available data) and Abstracts Views on Vision4Press platform.
Data correspond to usage on the plateform after 2015. The current usage metrics is available 48-96 hours after online publication and is updated daily on week days.
Initial download of the metrics may take a while.