Fig. 2
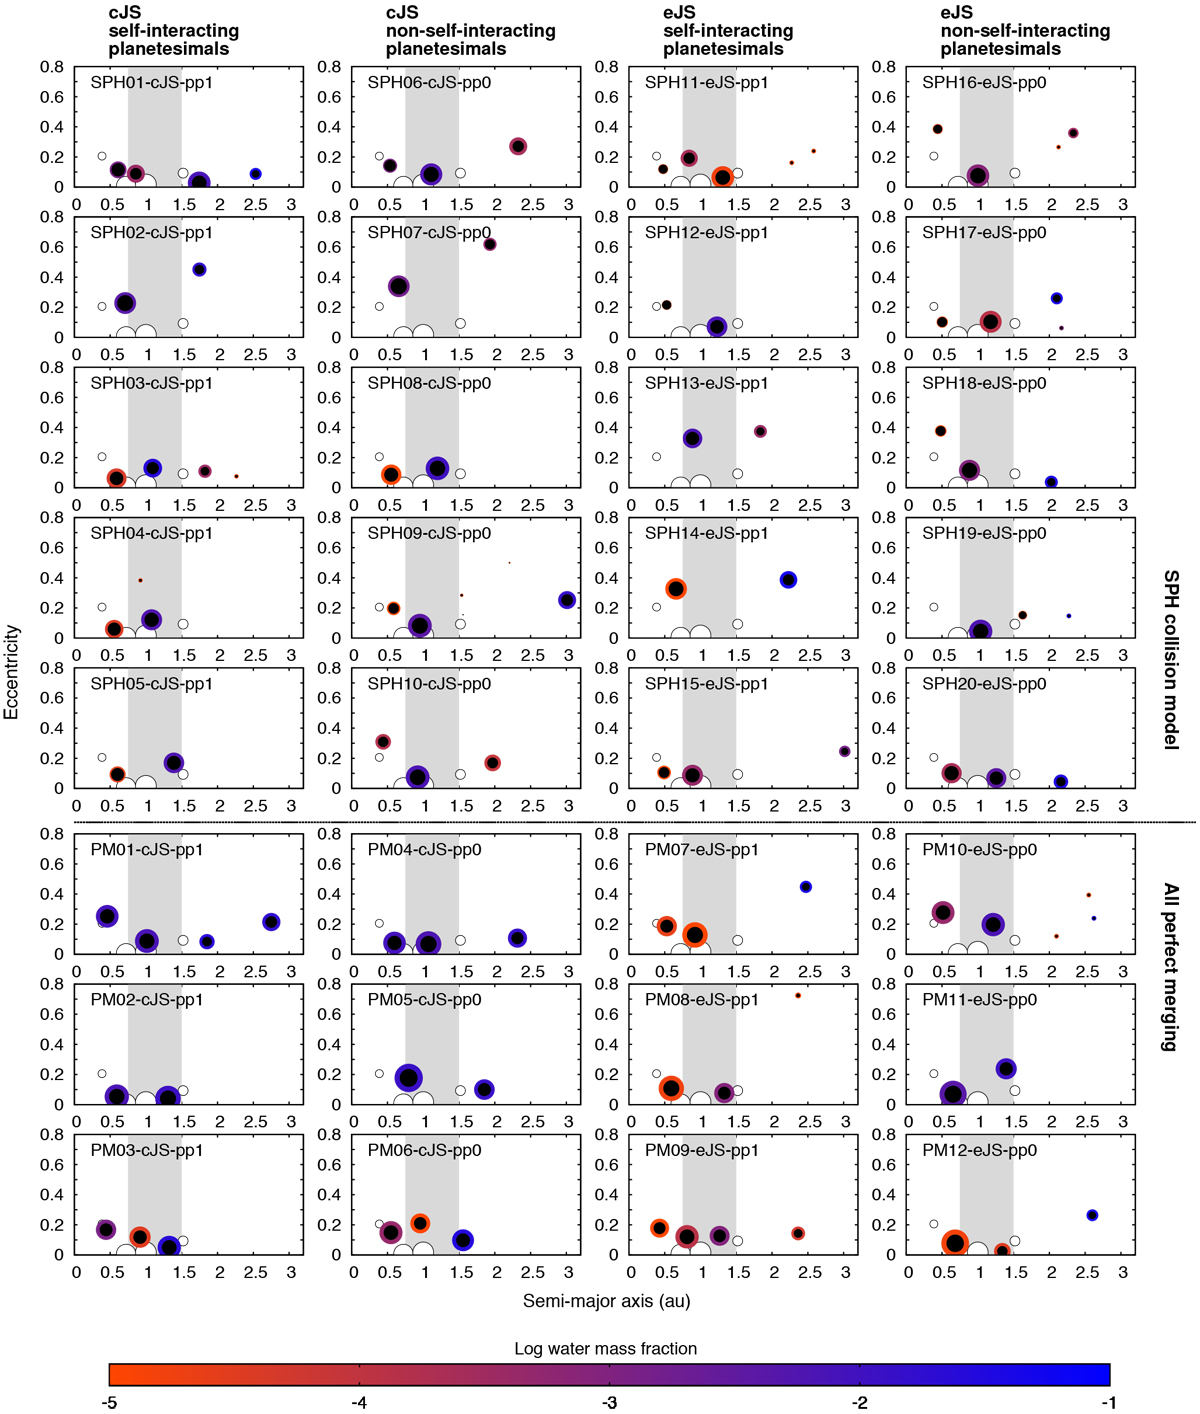
Final systems for all regular scenarios (cf. Table 1). Each column represents a particular giant planet architecture (cJS or eJS) and mode of planetesimal–planetesimal interaction (pp1 or pp0). Upper five rows: results based on the SPH collision model, lower three: PM comparison runs. The sizes of planets and their iron cores (black) are proportional to mass1∕3. The region corresponding to our definition of potentially habitable planets (see Sect. 6.1) is indicated as a gray bar, and the Solar System planets are plotted as open circles as a reference.
Current usage metrics show cumulative count of Article Views (full-text article views including HTML views, PDF and ePub downloads, according to the available data) and Abstracts Views on Vision4Press platform.
Data correspond to usage on the plateform after 2015. The current usage metrics is available 48-96 hours after online publication and is updated daily on week days.
Initial download of the metrics may take a while.