Free Access
Fig. 10
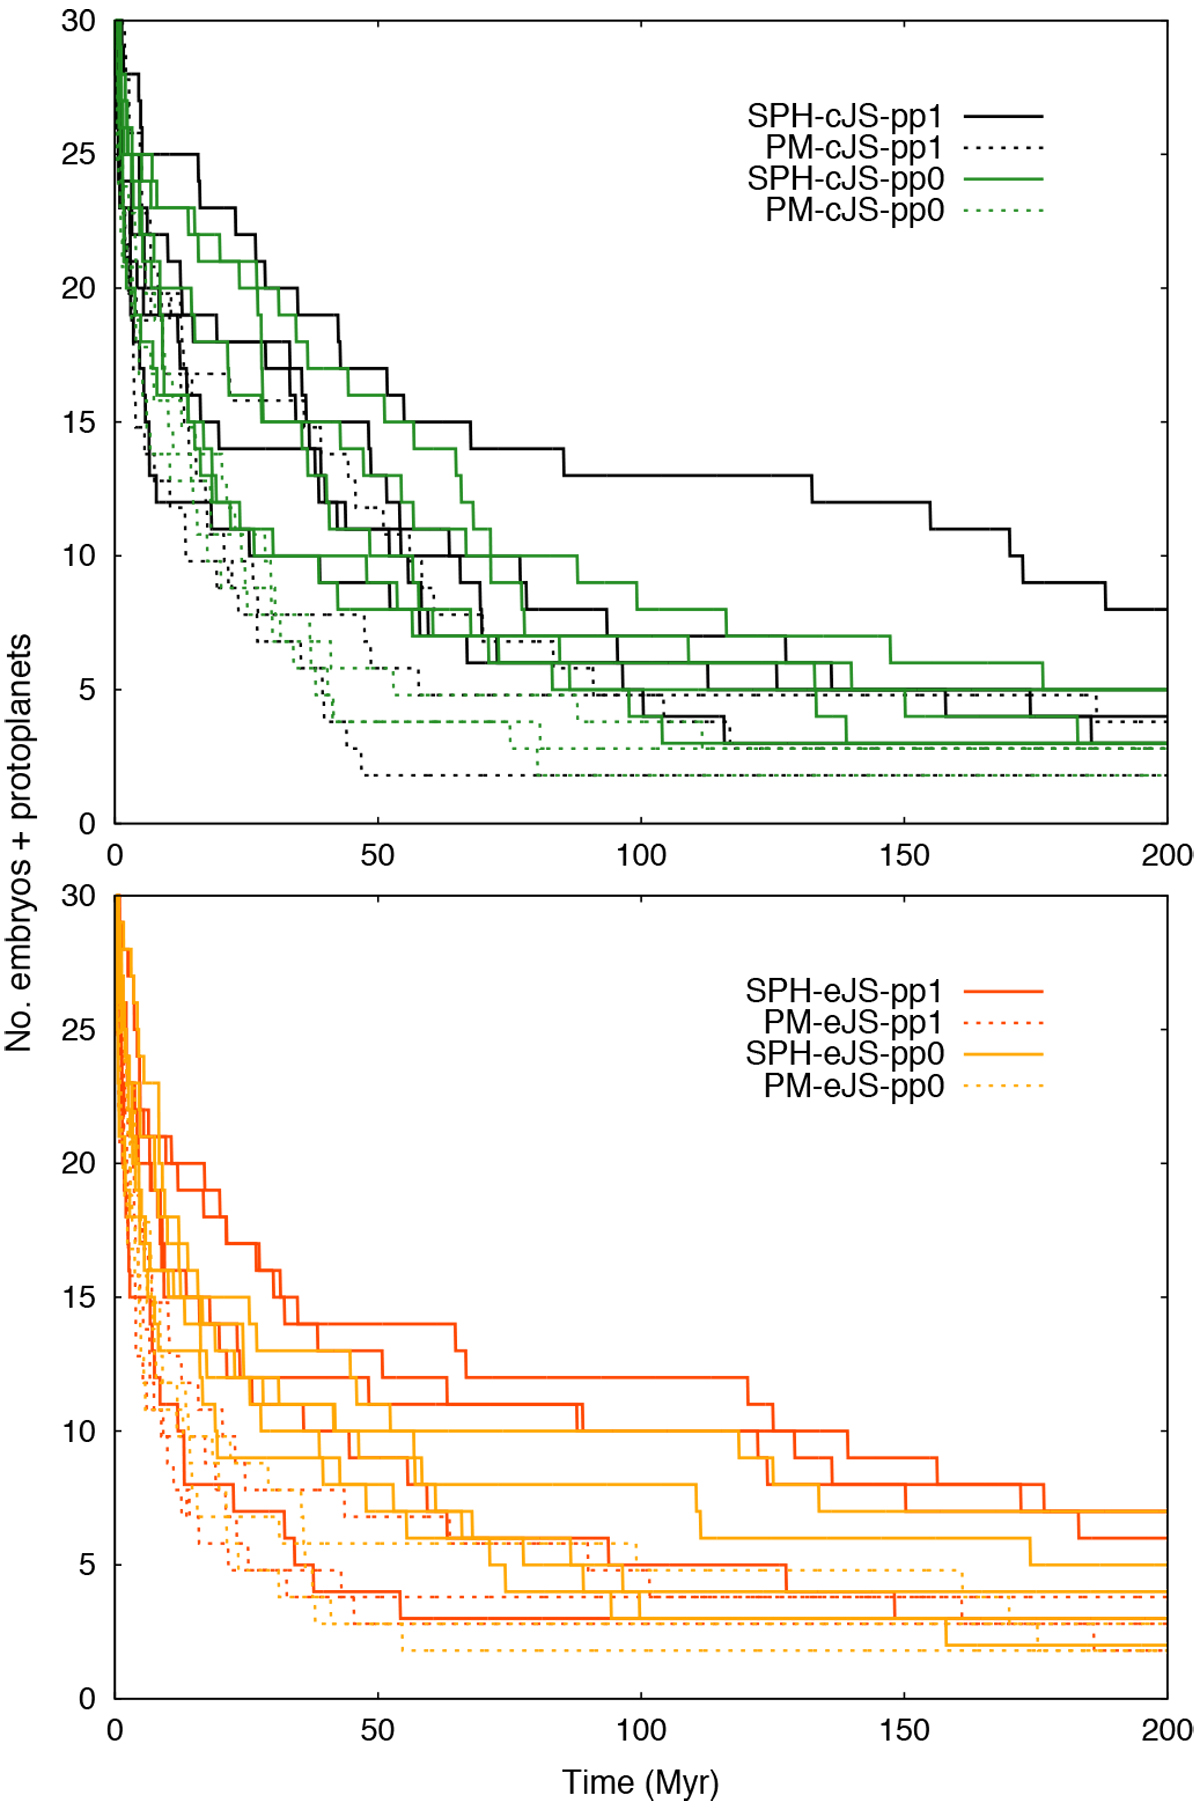
Number of embryos + protoplanets (i.e., excluding planetesimals) over time for all regular scenarios, split into cJS (upper panel) and eJS (lower panel) for better visibility. The respective “PM” curves have a slight y-offset of −0.2 for the samereason.
Current usage metrics show cumulative count of Article Views (full-text article views including HTML views, PDF and ePub downloads, according to the available data) and Abstracts Views on Vision4Press platform.
Data correspond to usage on the plateform after 2015. The current usage metrics is available 48-96 hours after online publication and is updated daily on week days.
Initial download of the metrics may take a while.