Fig. 2.
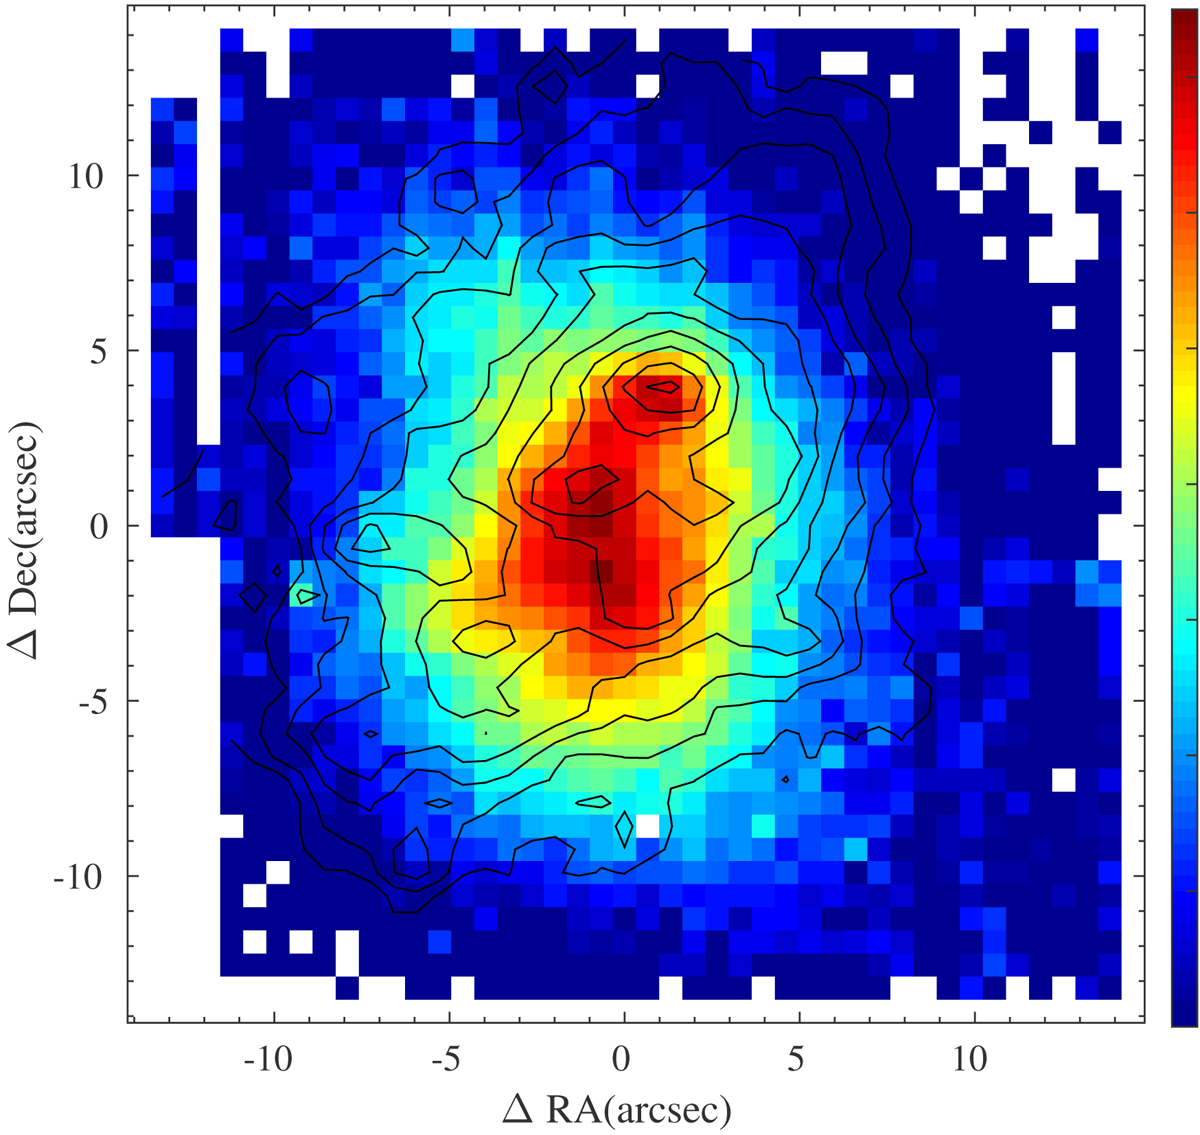
Mrk 900 continuum map from the VIMOS/IFU data built by summing over the whole blue spectral range (4150–6200 Å), but masking the emission lines. Contours in Hα are overplotted. The scale is logarithmic and the units are arbitrary. The FoV is ∼2.5 × 2.5 kpc2, with a spatial resolution of about 61 pc per spaxel. North is up and east to the left; the axes represent the displacements in RA and Dec with respect to the center of the FoV, also in all the maps presented from here on.
Current usage metrics show cumulative count of Article Views (full-text article views including HTML views, PDF and ePub downloads, according to the available data) and Abstracts Views on Vision4Press platform.
Data correspond to usage on the plateform after 2015. The current usage metrics is available 48-96 hours after online publication and is updated daily on week days.
Initial download of the metrics may take a while.