Fig. 5.
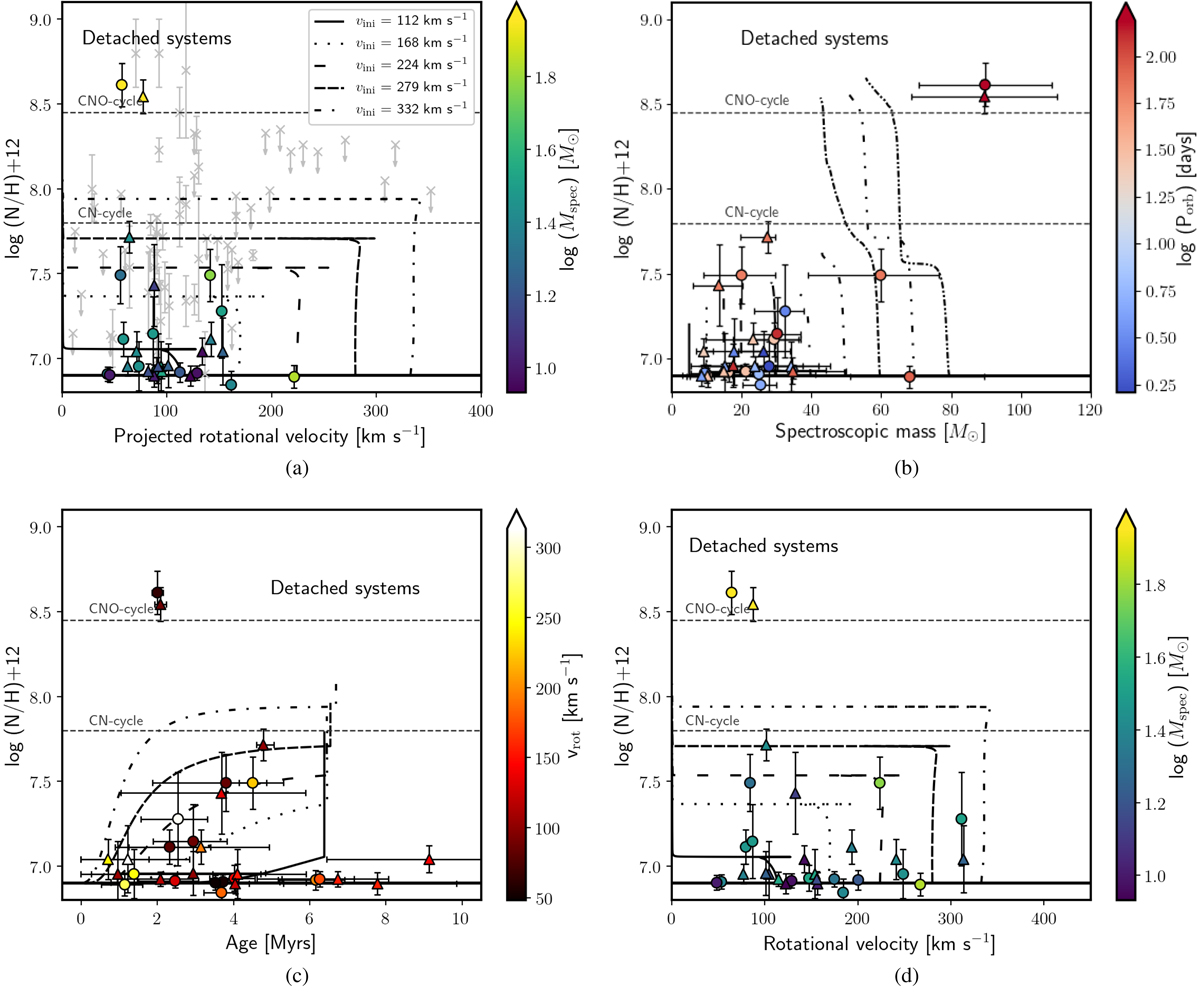
a: projected rotational velocity vs. the nitrogen content of the stars in detached systems (i.e., subsamples 1 and 2: see Sect. 4). The circles represent the primaries whilst the triangles represent the secondaries of our sample. As a comparison, we also plot in grey the population of single giant and supergiant O-type stars in the 30 Doradus region (Grin et al. 2017). Tracks are from Brott et al. (2011a); in the top panel, they correspond to an initial mass of 25 M⊙. The colour-bar represents the spectroscopic masses of the components. b: spectroscopic mass vs. the nitrogen content of the stars in detached systems (i.e. subsamples 1 and 2: see Sect. 4). The colour-bar represents the orbital period of the systems. c: age vs. the nitrogen content of the stars in detached systems (i.e. subsamples 1 and 2: see Sect. 4). The colour-bar represents the initial rotational velocity of the stars. d: rotational velocity vs. nitrogen content of the stars in detached systems (i.e. groups 1 and 2). The colour-bar represents the spectroscopic masses of the components.
Current usage metrics show cumulative count of Article Views (full-text article views including HTML views, PDF and ePub downloads, according to the available data) and Abstracts Views on Vision4Press platform.
Data correspond to usage on the plateform after 2015. The current usage metrics is available 48-96 hours after online publication and is updated daily on week days.
Initial download of the metrics may take a while.