Free Access
Fig. 4.
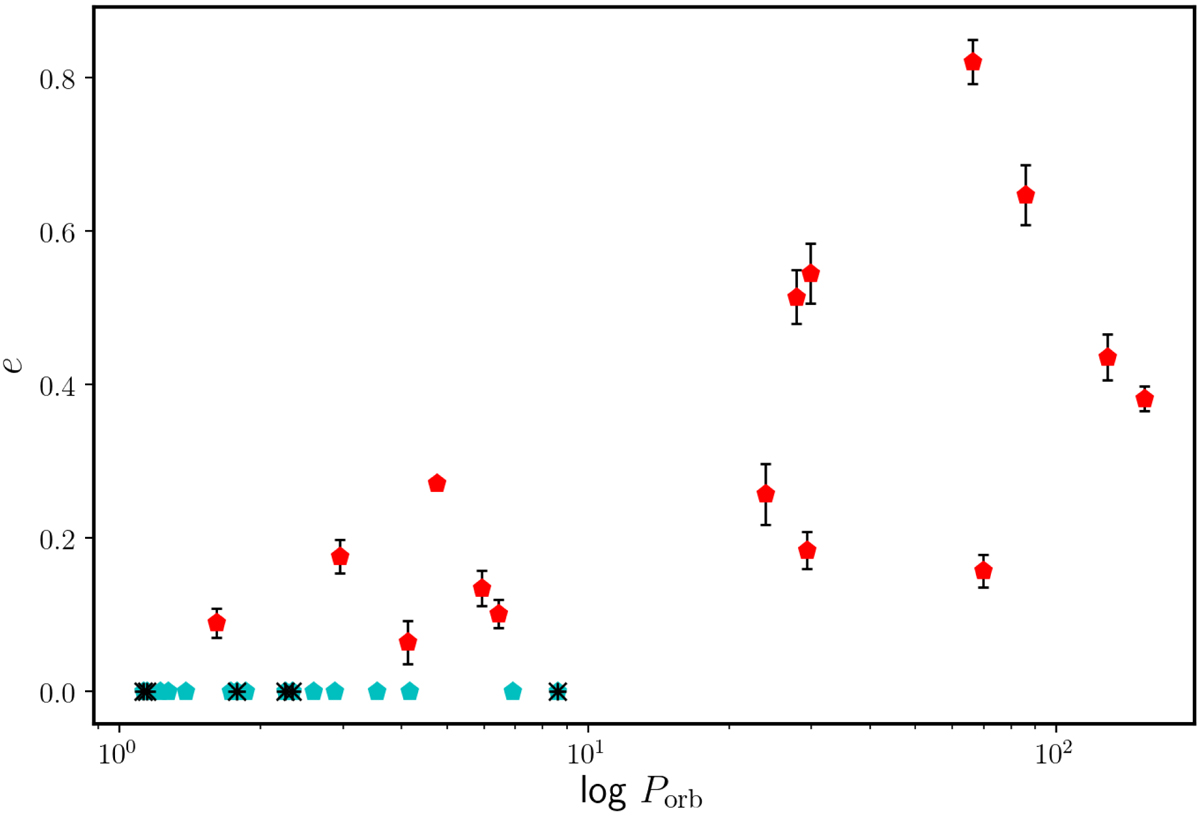
Period-eccentricity diagram for all the SB2 in our sample. The blue dots represent the systems displaying eclipses or ellipsoidal variations and the star symbols mark the systems that have one component filling its Roche lobe.
Current usage metrics show cumulative count of Article Views (full-text article views including HTML views, PDF and ePub downloads, according to the available data) and Abstracts Views on Vision4Press platform.
Data correspond to usage on the plateform after 2015. The current usage metrics is available 48-96 hours after online publication and is updated daily on week days.
Initial download of the metrics may take a while.