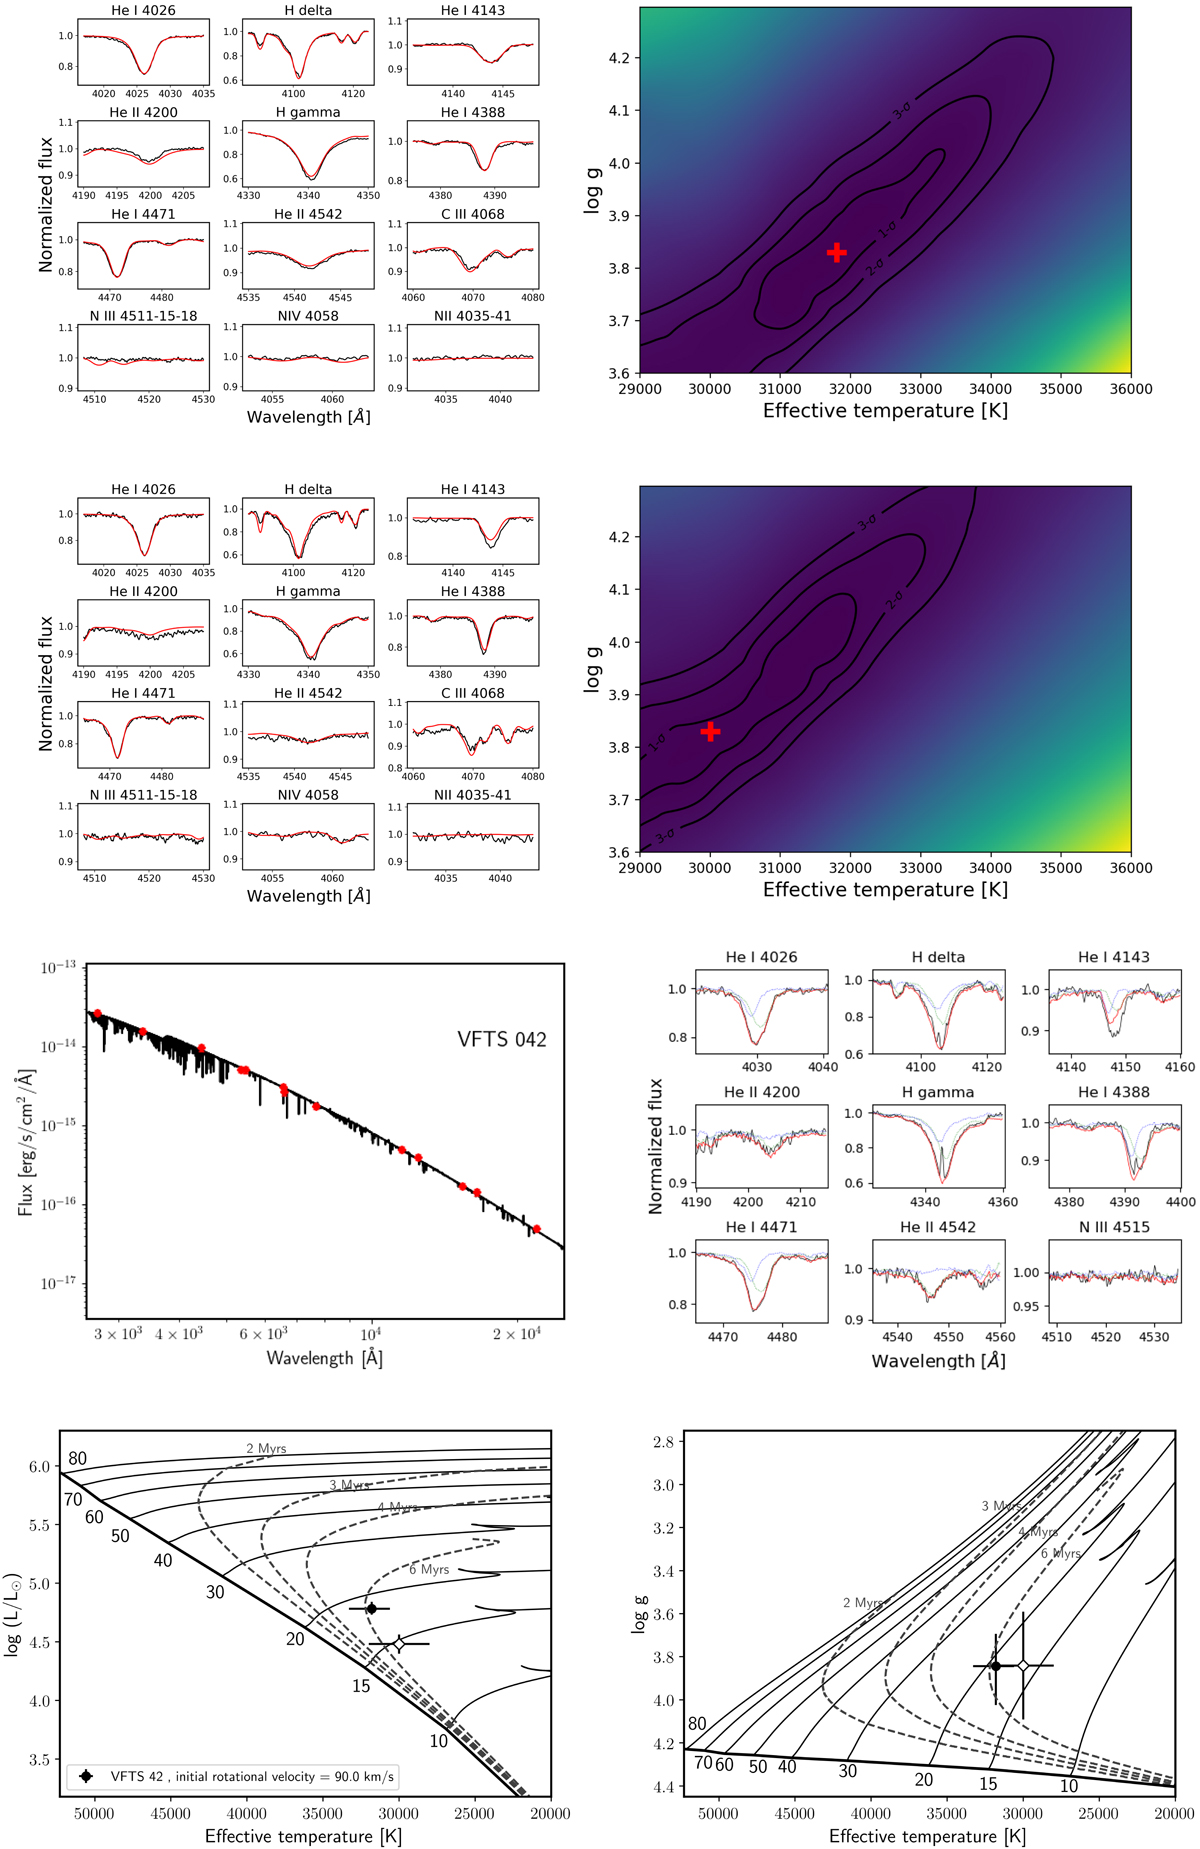
Fig. B.1.
From top to bottom and left to right: (1) Best-fit model of VFTS 042 primary (red line) compared with the disentangled spectrum (black line), (2) determination of the Teff and log g via the chi-square map for this star. The red cross indicates the position of the minimum χ2, (3) and (4) same as for (1) and (2), but for the secondary. (5) Spectral Energy Distribution of VFTS 042. (6) Comparison between the disentangled spectra (scaled by the brightness factor of each component and shifted by their radial velocities) and one observed spectrum (7) Individual HRD (Left) and (8) log g–Teff diagram of the stars of VFTS 042.
Current usage metrics show cumulative count of Article Views (full-text article views including HTML views, PDF and ePub downloads, according to the available data) and Abstracts Views on Vision4Press platform.
Data correspond to usage on the plateform after 2015. The current usage metrics is available 48-96 hours after online publication and is updated daily on week days.
Initial download of the metrics may take a while.