Free Access
Fig. 11.
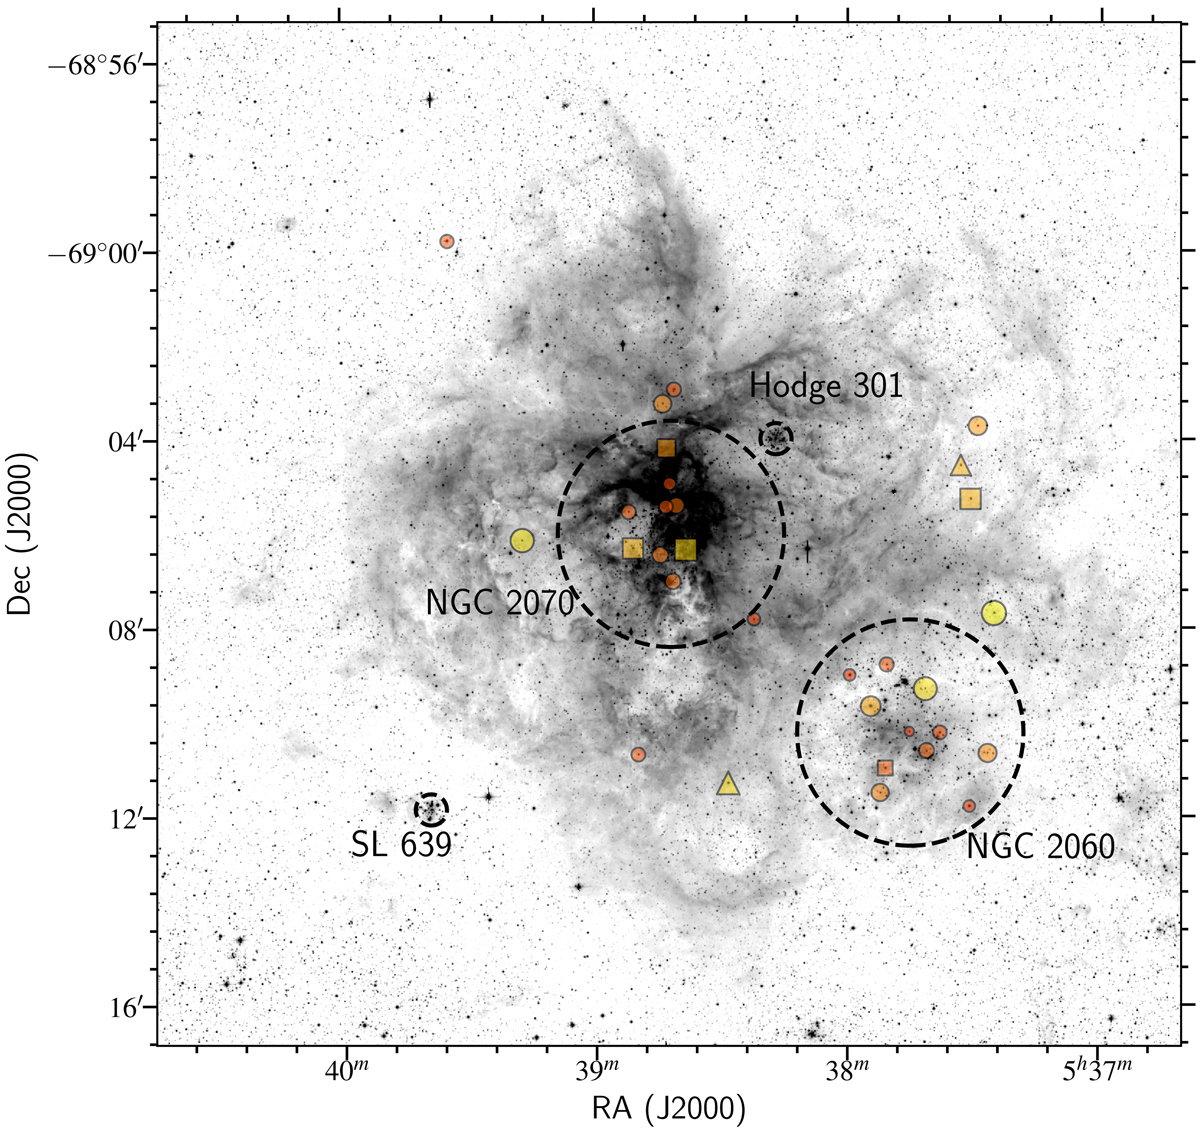
Spatial distribution of the mean ages of the systems. The youngest systems are shown in red while the oldest ones are shown in yellow. The circles indicate the detached systems (subsamples 1, 2, and 3), the triangles the over-contact systems (subsample 4), and the squares the semi-detached systems (subsample 5).
Current usage metrics show cumulative count of Article Views (full-text article views including HTML views, PDF and ePub downloads, according to the available data) and Abstracts Views on Vision4Press platform.
Data correspond to usage on the plateform after 2015. The current usage metrics is available 48-96 hours after online publication and is updated daily on week days.
Initial download of the metrics may take a while.