Fig. 6.
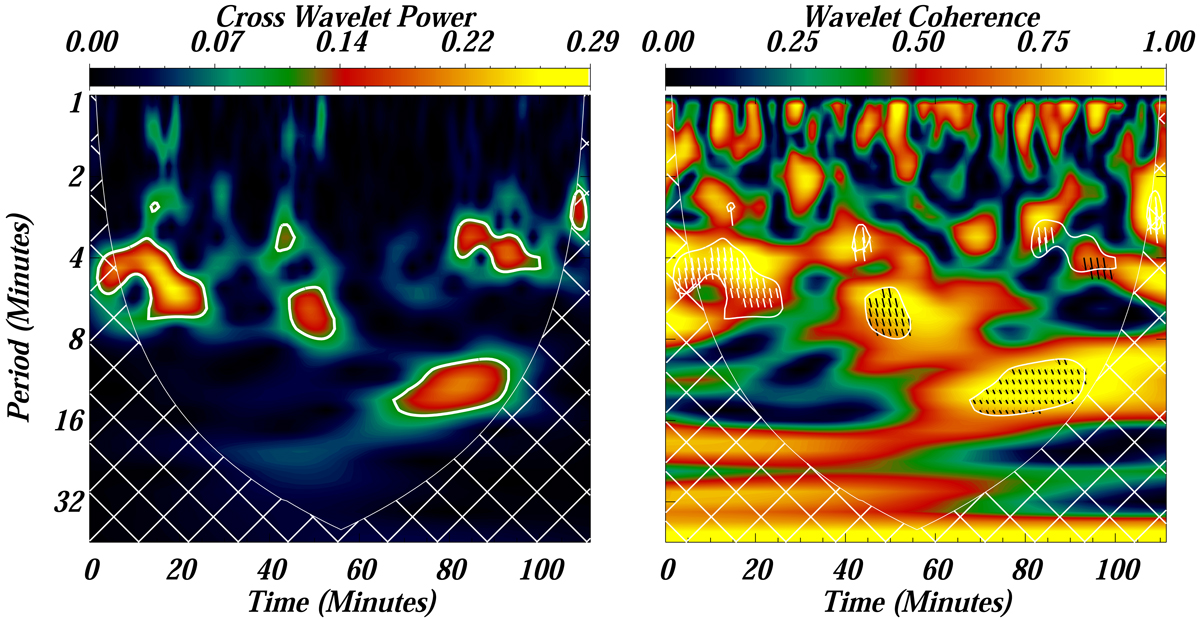
Left panel: normalized cross wavelet power between AIA 1700 Å and IRIS SJI 1400 Å. The normalized cross power is distributed in a period range similar to that in the case of wavelet power of photosphere and TR (cf. Fig. 4). Right panel: wavelet coherence is displayed along with the overplotted phase difference angle (black and purple arrows) within the high-coherence regime (above 0.6). Negative phase difference (black arrows) represent downward propagating waves, while positive phase difference (purple arrows) indicates upwardly propagating waves. It is clearly visible that below 7.0 min the waves are propagating upward into the TR from the photosphere. The white contours outline the 95% confidence levels, while the white cross-hatched area outlines the COI.
Current usage metrics show cumulative count of Article Views (full-text article views including HTML views, PDF and ePub downloads, according to the available data) and Abstracts Views on Vision4Press platform.
Data correspond to usage on the plateform after 2015. The current usage metrics is available 48-96 hours after online publication and is updated daily on week days.
Initial download of the metrics may take a while.