Fig. 4.
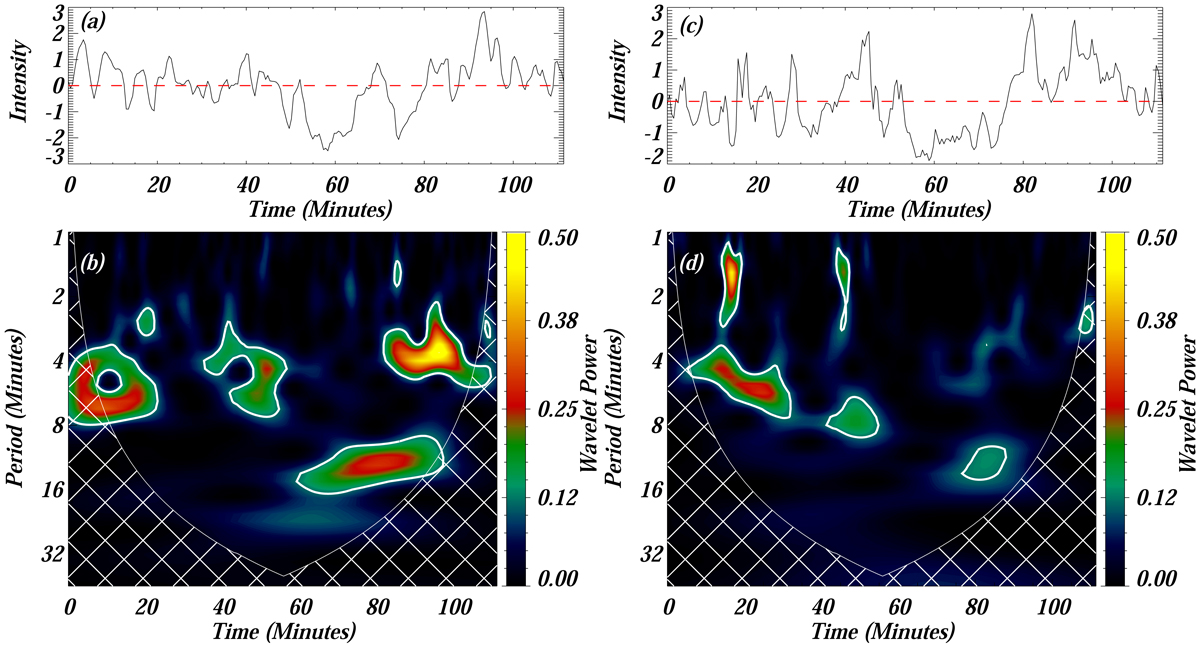
Panel a: AIA 1700 Å TS. Panel b: corresponding normalized wavelet power. The photospheric power is mainly concentrated in the broad range (2−9 min), as outlined by white contours (95% global confidence levels). Panels c and d: IRIS SJI 1400 Å TS and its corresponding normalized wavelet power, respectively. The power within the TR is distributed within the period of 2−8 min. The white contours in each wavelet map (panels b and d) outline the 95% global confidence levels. The cross-hatched white area outlines the COI.
Current usage metrics show cumulative count of Article Views (full-text article views including HTML views, PDF and ePub downloads, according to the available data) and Abstracts Views on Vision4Press platform.
Data correspond to usage on the plateform after 2015. The current usage metrics is available 48-96 hours after online publication and is updated daily on week days.
Initial download of the metrics may take a while.