Fig. 6.
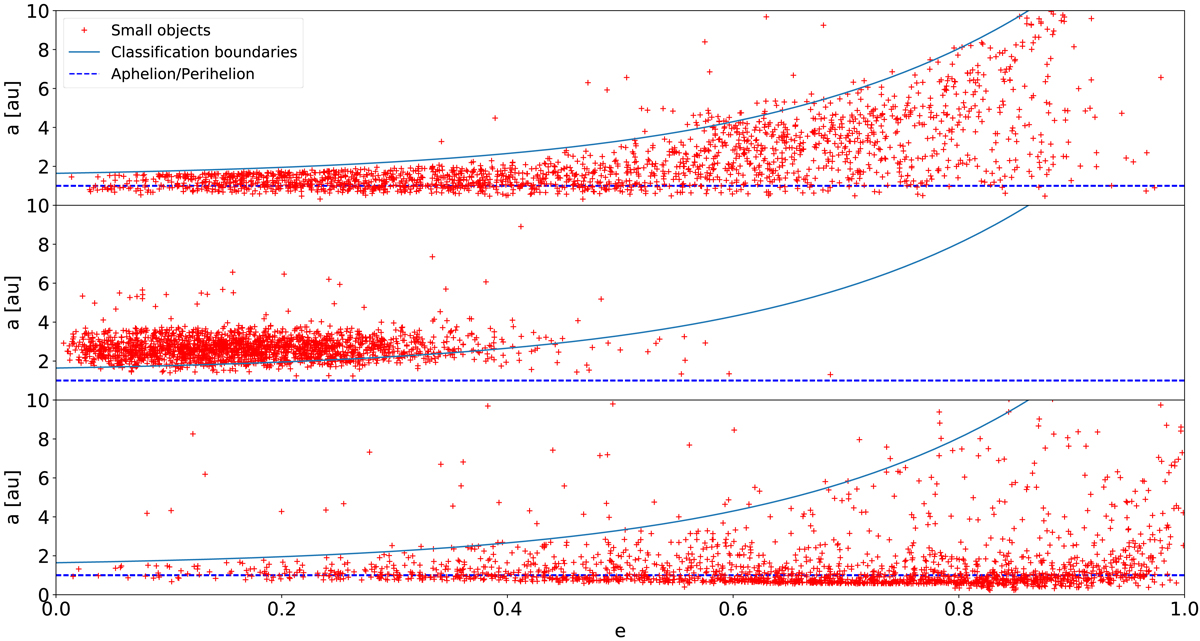
Semi-major axis versus eccentricity for 2000 PI, UO, and KI objects, respectively, from top to bottom. The dotted blue lines represent the aphelion and perihelion distances of Earth’s orbit and the teal curves represent the “classification boundary” where objects below are likely to be classified as PIs and those above are likely to be classified as benign.
Current usage metrics show cumulative count of Article Views (full-text article views including HTML views, PDF and ePub downloads, according to the available data) and Abstracts Views on Vision4Press platform.
Data correspond to usage on the plateform after 2015. The current usage metrics is available 48-96 hours after online publication and is updated daily on week days.
Initial download of the metrics may take a while.