Fig. 6
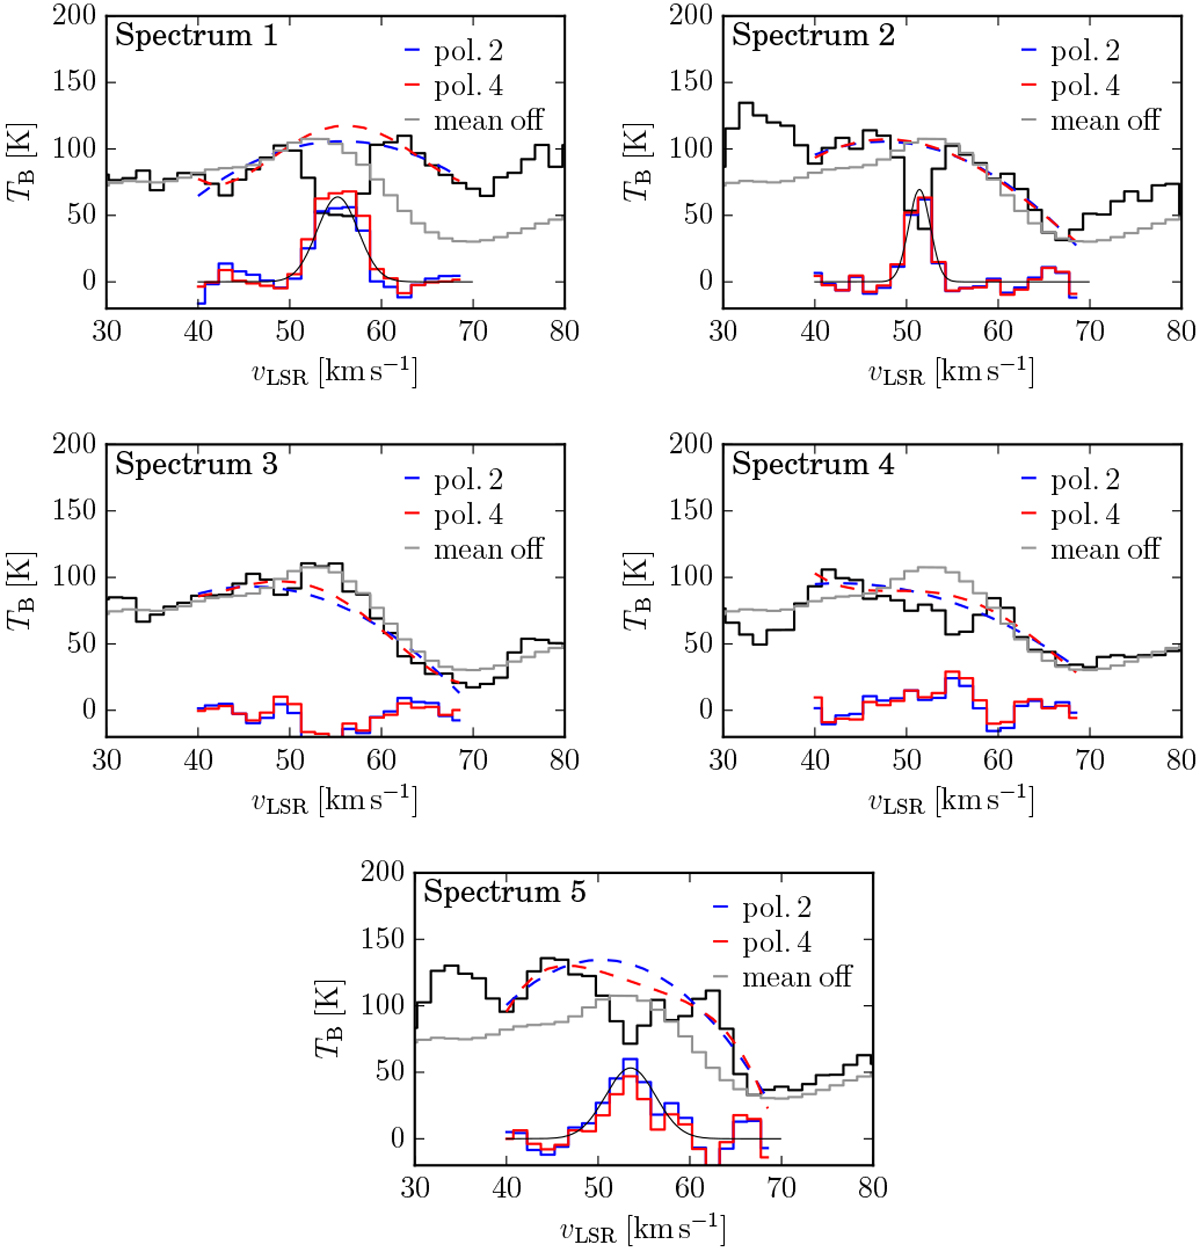
Selected H I emission spectra corresponding the positions indicated in Fig. 1. The black lines represent the H I spectra, the colors correspond to the HISA. The gray spectra indicate the mean of the five off-positionspresented in Fig. 5. The blue and red dashed lines represent the fits of the background to the HISA spectrum for a polynomial of second and fourth order, respectively, using the velocity range of vLSR = 40−50 and 60−70 km s−1 for the baseline of the fit. The blue and red solid lines show the difference between fitted H I spectra and the measured H I spectra (Ton-off in Eq. (4)) for a polynomial of second and fourth order, respectively. We fitted Spectra 1, 2, and 5 using a Gaussian function, shown by the black solid curve on top of the HISA spectra.
Current usage metrics show cumulative count of Article Views (full-text article views including HTML views, PDF and ePub downloads, according to the available data) and Abstracts Views on Vision4Press platform.
Data correspond to usage on the plateform after 2015. The current usage metrics is available 48-96 hours after online publication and is updated daily on week days.
Initial download of the metrics may take a while.