Fig. 18
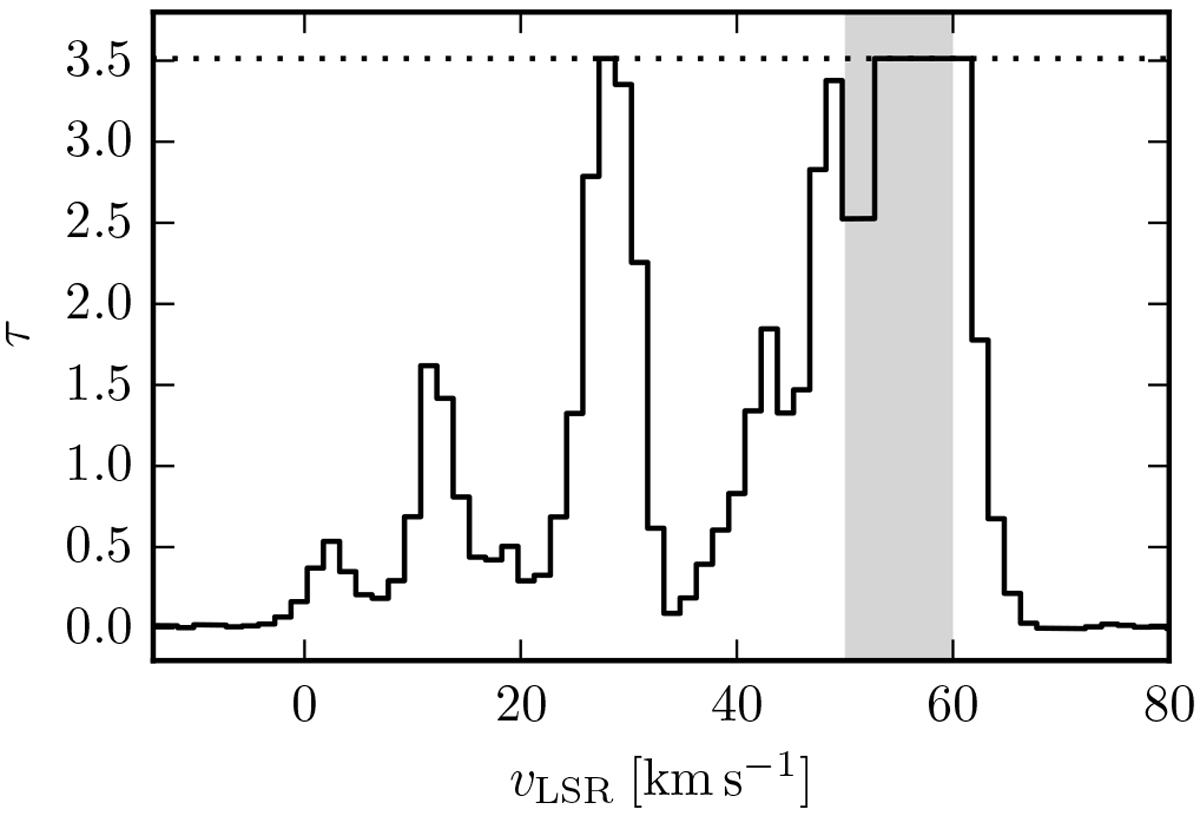
Spectrum of the H I optical depth towards the UCH II region G34.256+0.146 using the THOR data. For some channels, the absorption spectra saturates and the measured optical depth is a lower limit of τ = 3.5, which is indicated by the dotted line. The gray shaded area indicates the velocity range of the HISA feature (vLSR = 50−60 km s−1).
Current usage metrics show cumulative count of Article Views (full-text article views including HTML views, PDF and ePub downloads, according to the available data) and Abstracts Views on Vision4Press platform.
Data correspond to usage on the plateform after 2015. The current usage metrics is available 48-96 hours after online publication and is updated daily on week days.
Initial download of the metrics may take a while.