Open Access
Fig. 15
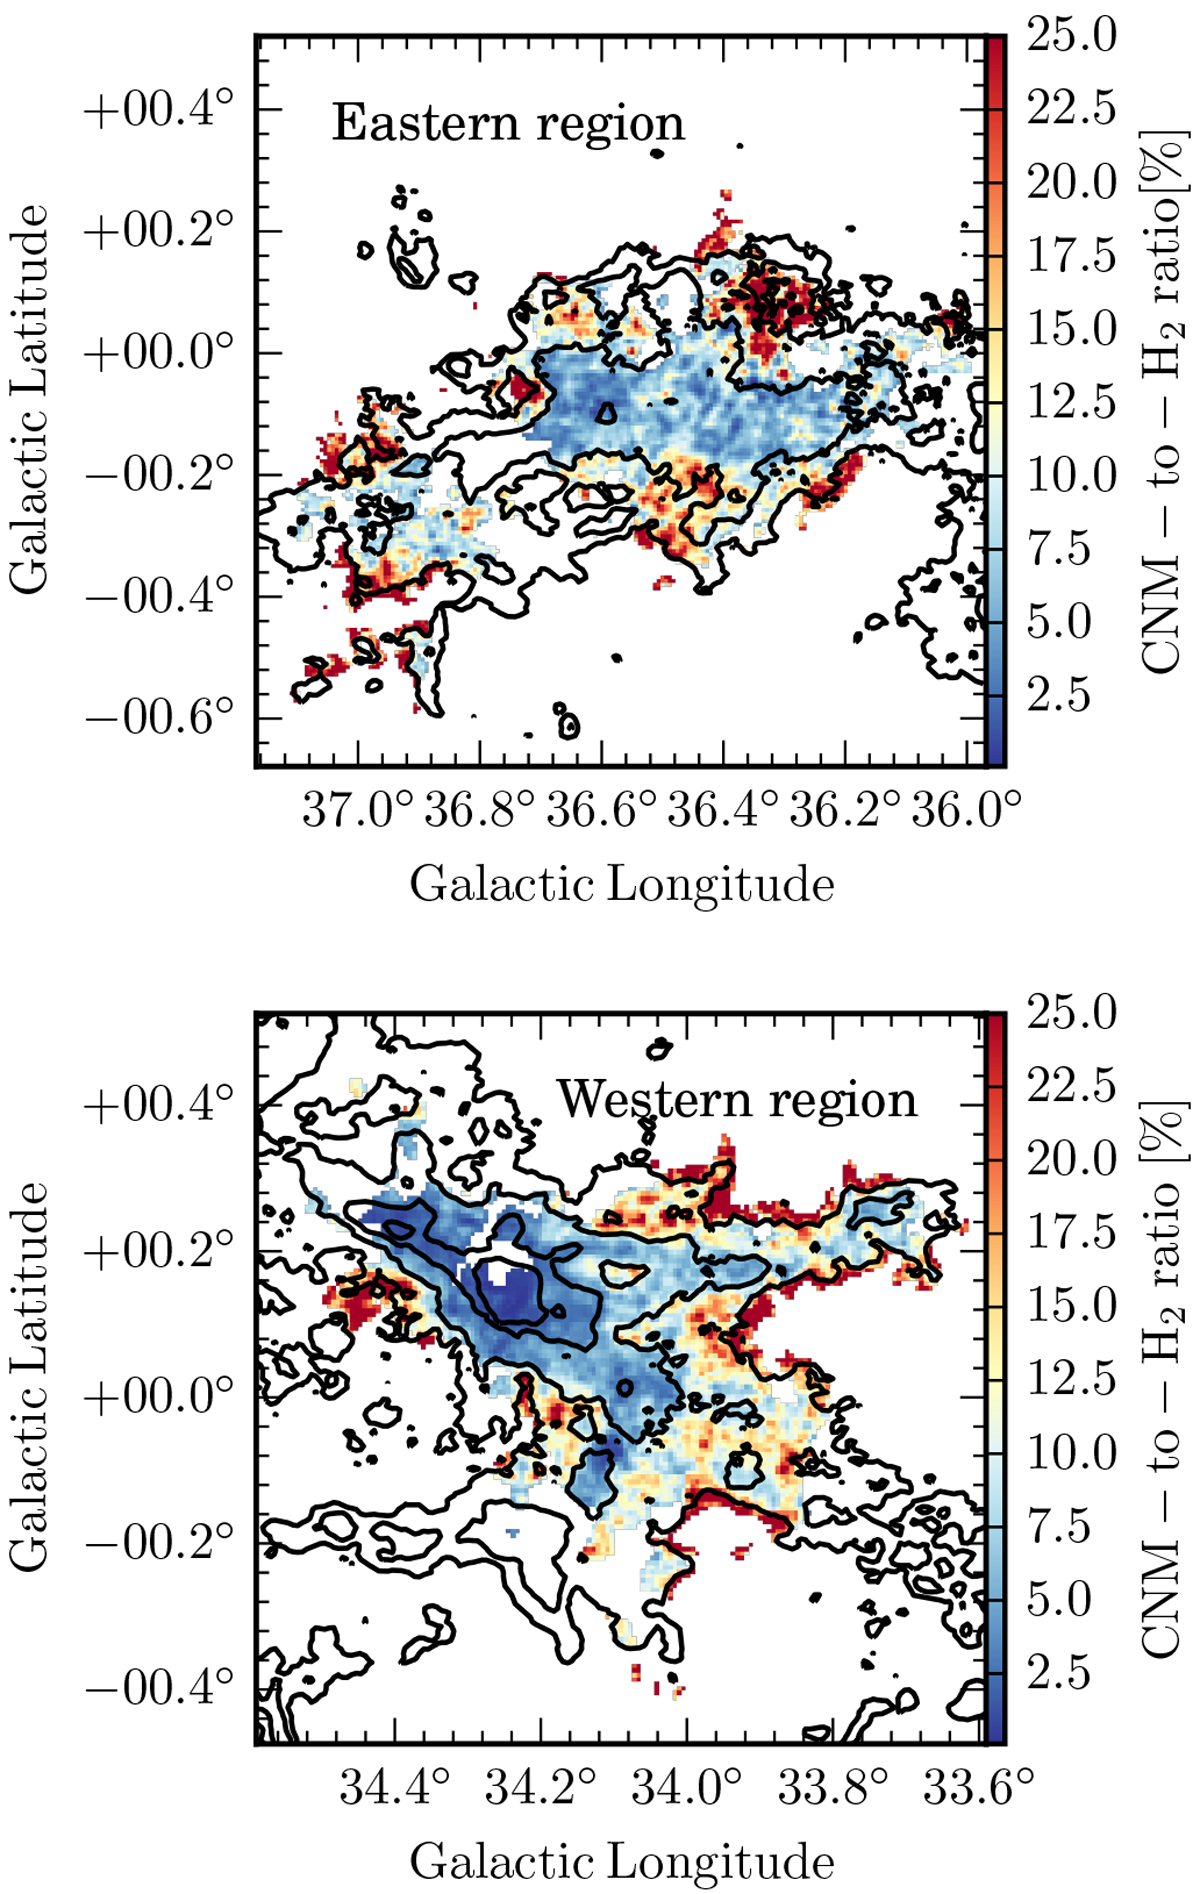
Ratio of the CNM and H2 column densities in percentage of the Eastern region (top panel) and Western region (bottom panel). The contours in both panels indicate the integrated 13CO emission at levels of 5, 10, 20, and 30 K km s−1.
Current usage metrics show cumulative count of Article Views (full-text article views including HTML views, PDF and ePub downloads, according to the available data) and Abstracts Views on Vision4Press platform.
Data correspond to usage on the plateform after 2015. The current usage metrics is available 48-96 hours after online publication and is updated daily on week days.
Initial download of the metrics may take a while.