Fig. 14
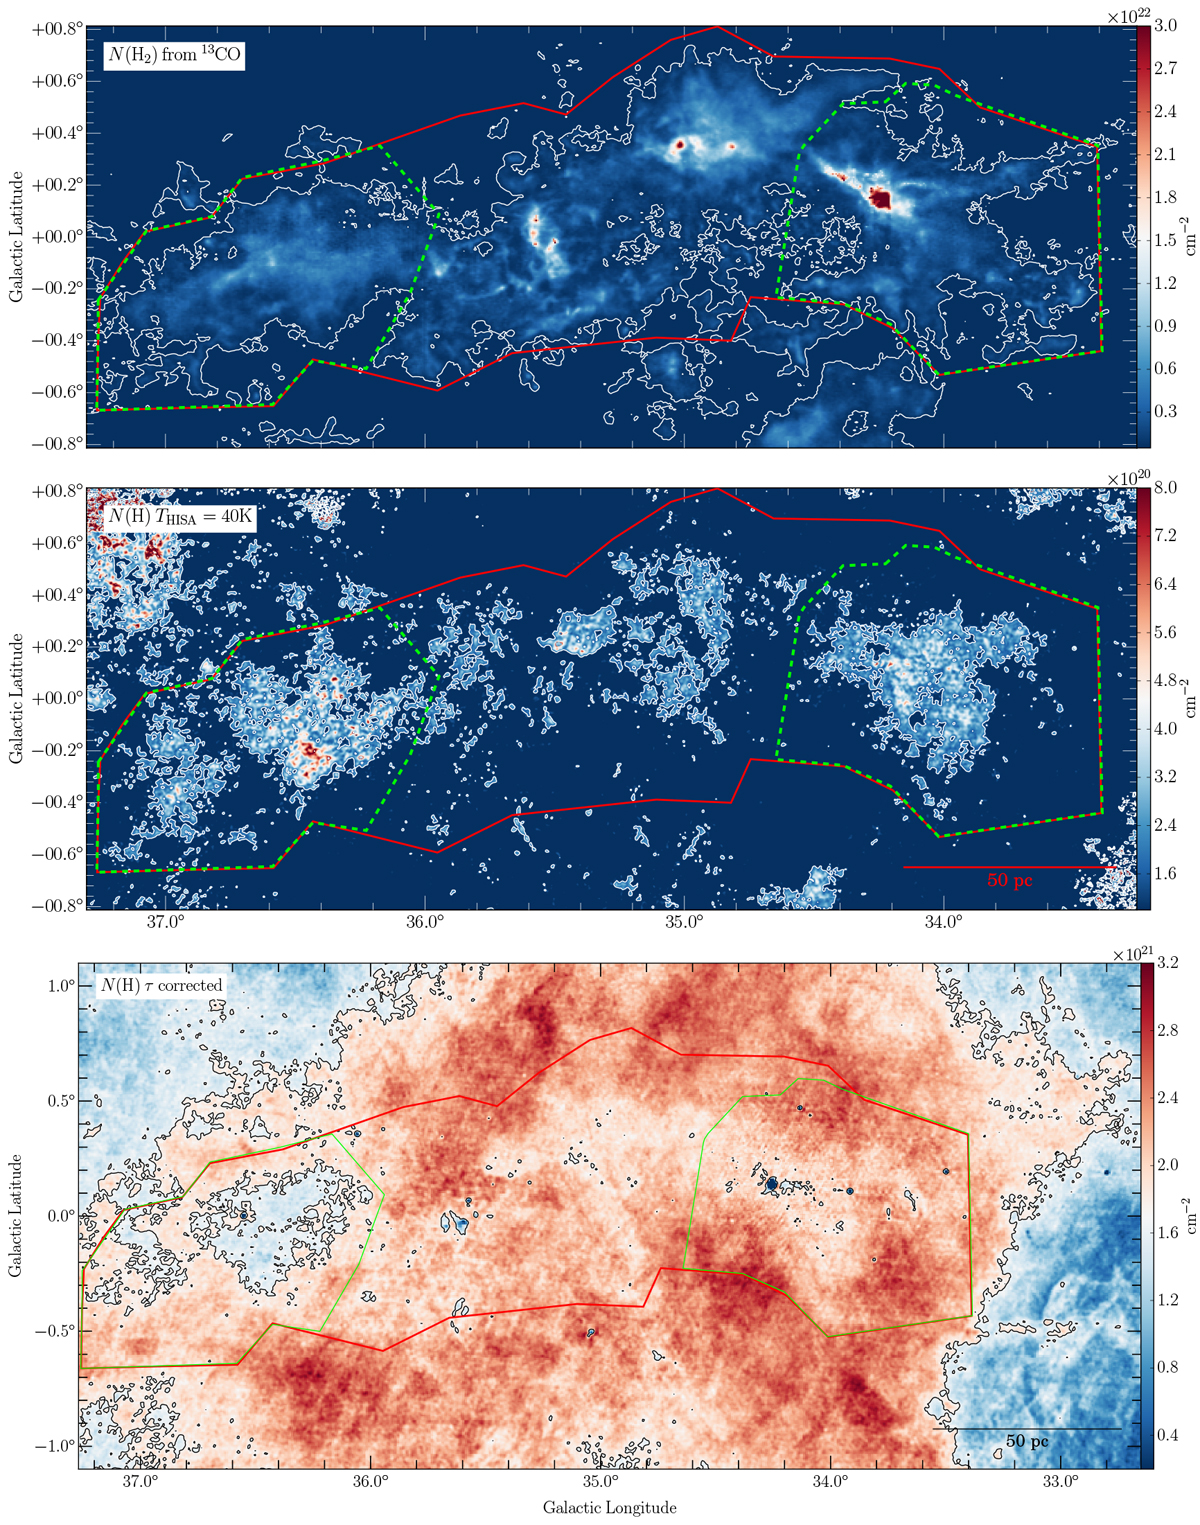
Top panel: column density map of the molecular cloud derived from 13CO emission (see Sect. 3.2.1). Middle panel: column density map of the CNM derived from HISA, assuming TS = 40 K, p = 0.9 and using a second order polynomial to estimate the background temperature Toff. Bottom panel: optical depth corrected column density map of atomic hydrogen derived from H I emission. The contours indicate column density threshold used for the N-PDFs (see Sect. 4.5). For the H2, HISA, and HI emission they have levels of 6 × 10²⁰, 1.5 × 10²⁰, and 1.7 × 1021 cm−2, respectively. The red and green polygons mark the region for the mass estimates and the column density PDF measurements shown in Figs. 20 and 22, respectively.
Current usage metrics show cumulative count of Article Views (full-text article views including HTML views, PDF and ePub downloads, according to the available data) and Abstracts Views on Vision4Press platform.
Data correspond to usage on the plateform after 2015. The current usage metrics is available 48-96 hours after online publication and is updated daily on week days.
Initial download of the metrics may take a while.