Fig. 5.
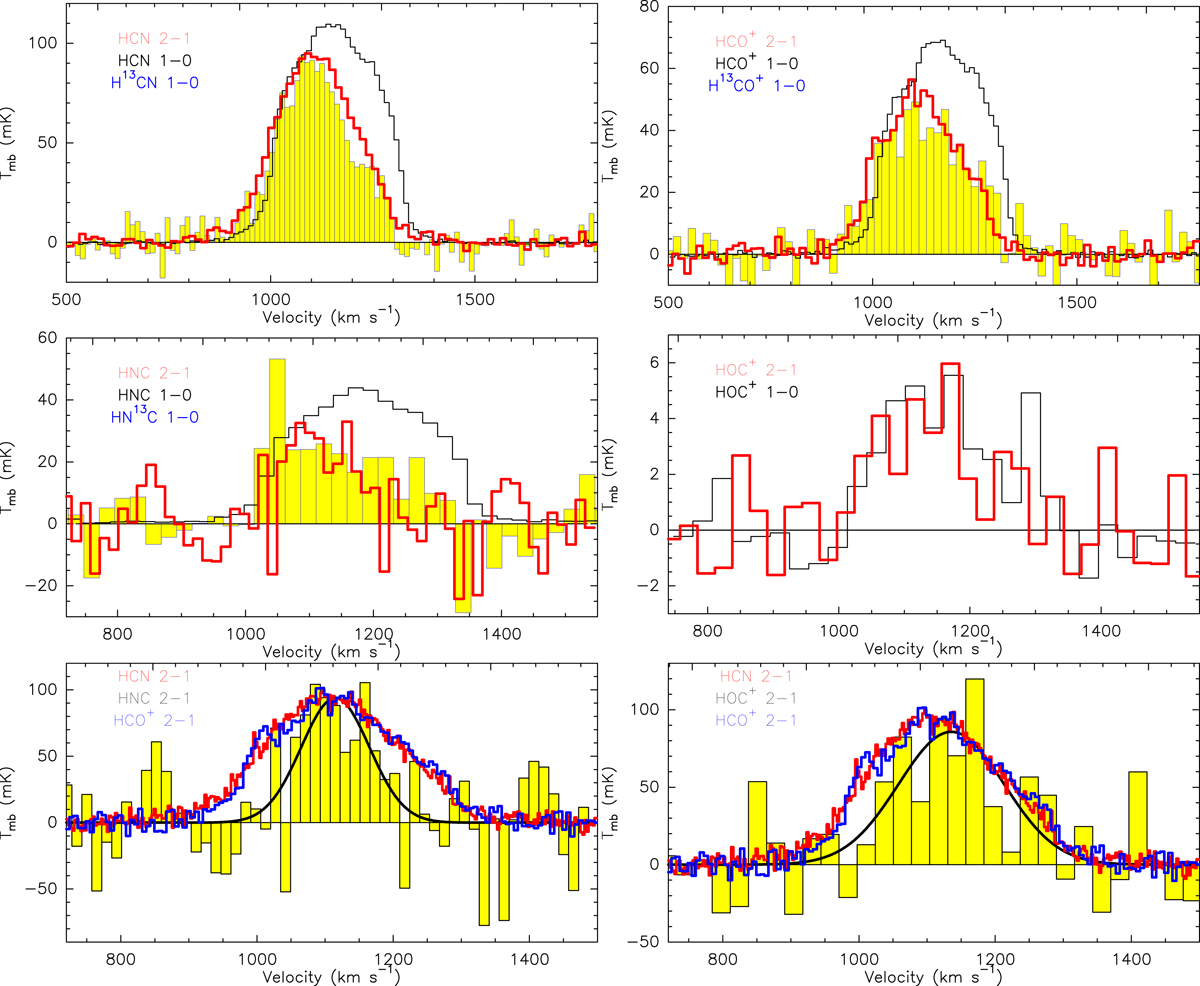
Upper left panel: HCN (2 − 1) (red line); H13CN (1 − 0) (blue line filled yellow, × 16); HCN (1 − 0) (black line, ×1.5). Upper right panel: HCO+ (2 − 1), H13CO+ (1 − 0)×18, HCO+ (1 − 0)×1.3. Middle left panel: HNC (2 − 1), HN13C (1 − 0)×35, HNC (1 − 0)×1.5. Middle right panel: HOC+ (2 − 1), HOC+ (1 − 0)×4. Lower left panel: HCN (2 − 1) (red line, ×3.2); HNC (2 − 1) (black line filled yellow, ×16); HCO+ (2 − 1) (black line, ×1.8); the black line curve is the Gaussian fitting line of HNC (2 − 1). Lower right panel: HCN (2 − 1) (red line); HOC+ (2 − 1) (black line filled yellow, × 20); HCO+ (2 − 1) (black line, ×1.8); the black line curve is the Gaussian fitting line of HOC+ (2 − 1).
Current usage metrics show cumulative count of Article Views (full-text article views including HTML views, PDF and ePub downloads, according to the available data) and Abstracts Views on Vision4Press platform.
Data correspond to usage on the plateform after 2015. The current usage metrics is available 48-96 hours after online publication and is updated daily on week days.
Initial download of the metrics may take a while.