Fig. 4.
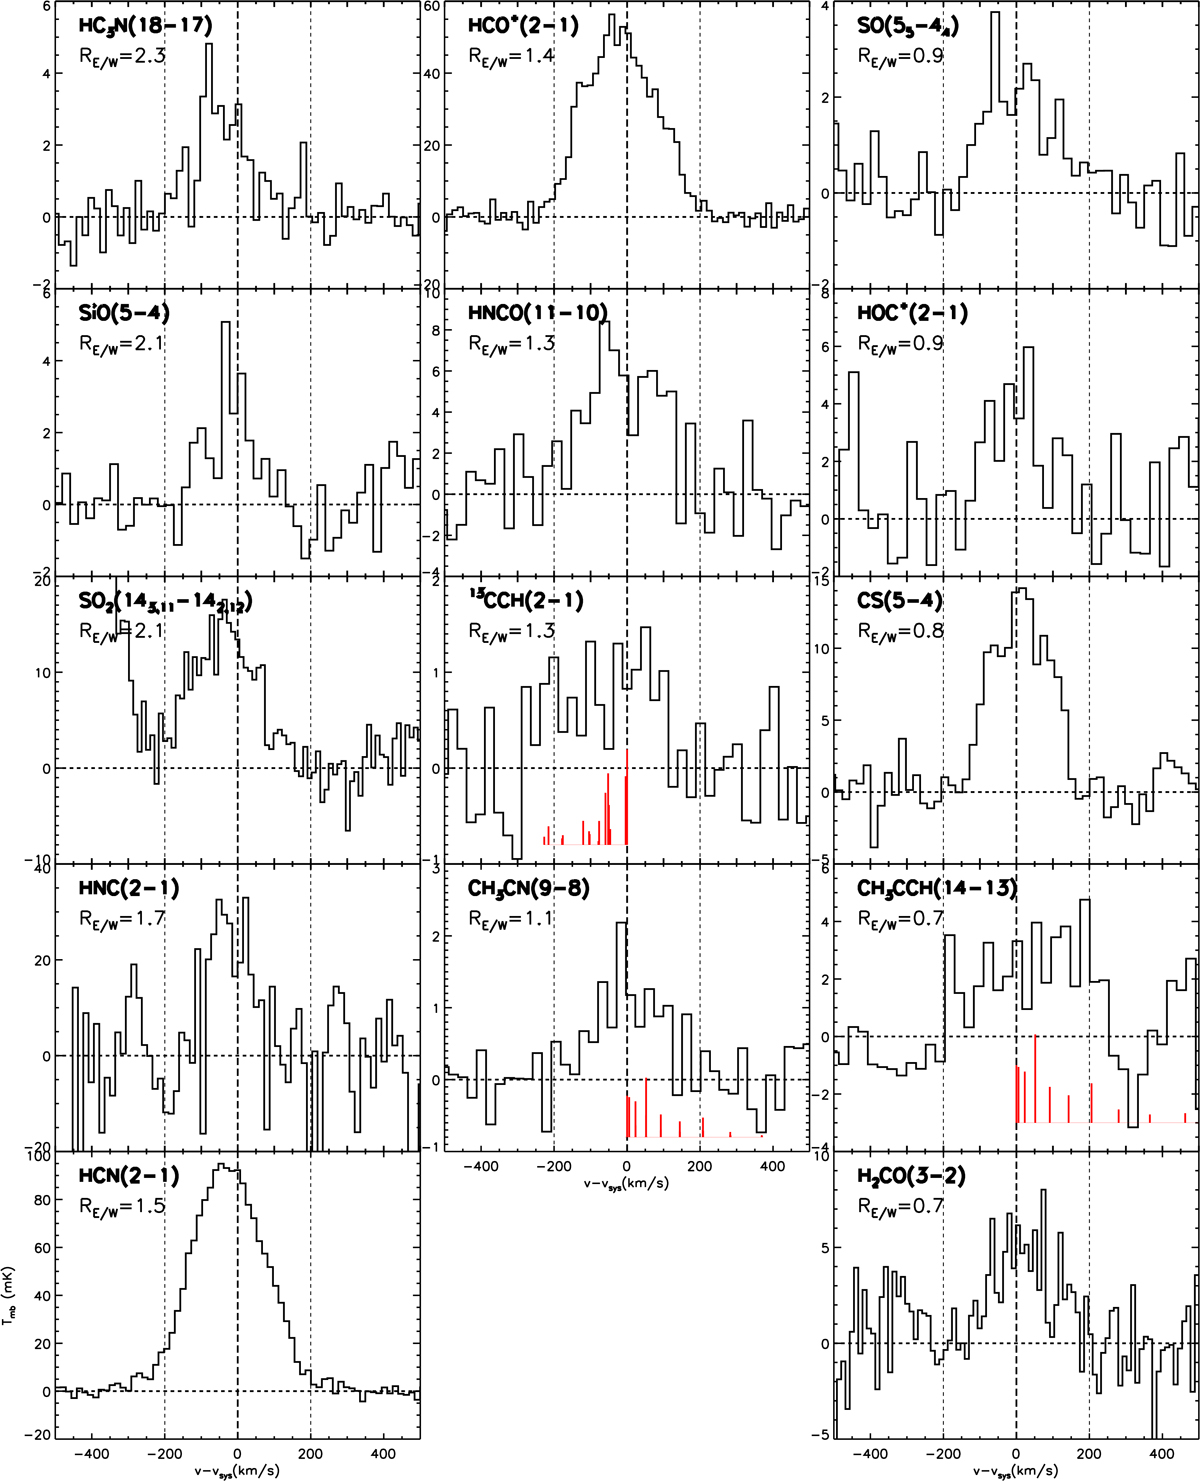
Profiles of the molecular lines at 1 mm and 2 mm bands, as detected in Qiu et al. (2017) and in the current observations. The three vertical dotted lines at v − vsys = −200 km s−1, v − vsys = 0 km s−1, and v − vsys = +200 km s−1 delimit the blue and red kinematical components. The wavelengths and relative intensities of the split components of 13CCH (2 − 1), CH3CN (9 − 8), and CH3CCH (14 − 13) are marked by red lines.
Current usage metrics show cumulative count of Article Views (full-text article views including HTML views, PDF and ePub downloads, according to the available data) and Abstracts Views on Vision4Press platform.
Data correspond to usage on the plateform after 2015. The current usage metrics is available 48-96 hours after online publication and is updated daily on week days.
Initial download of the metrics may take a while.