Fig. 2.
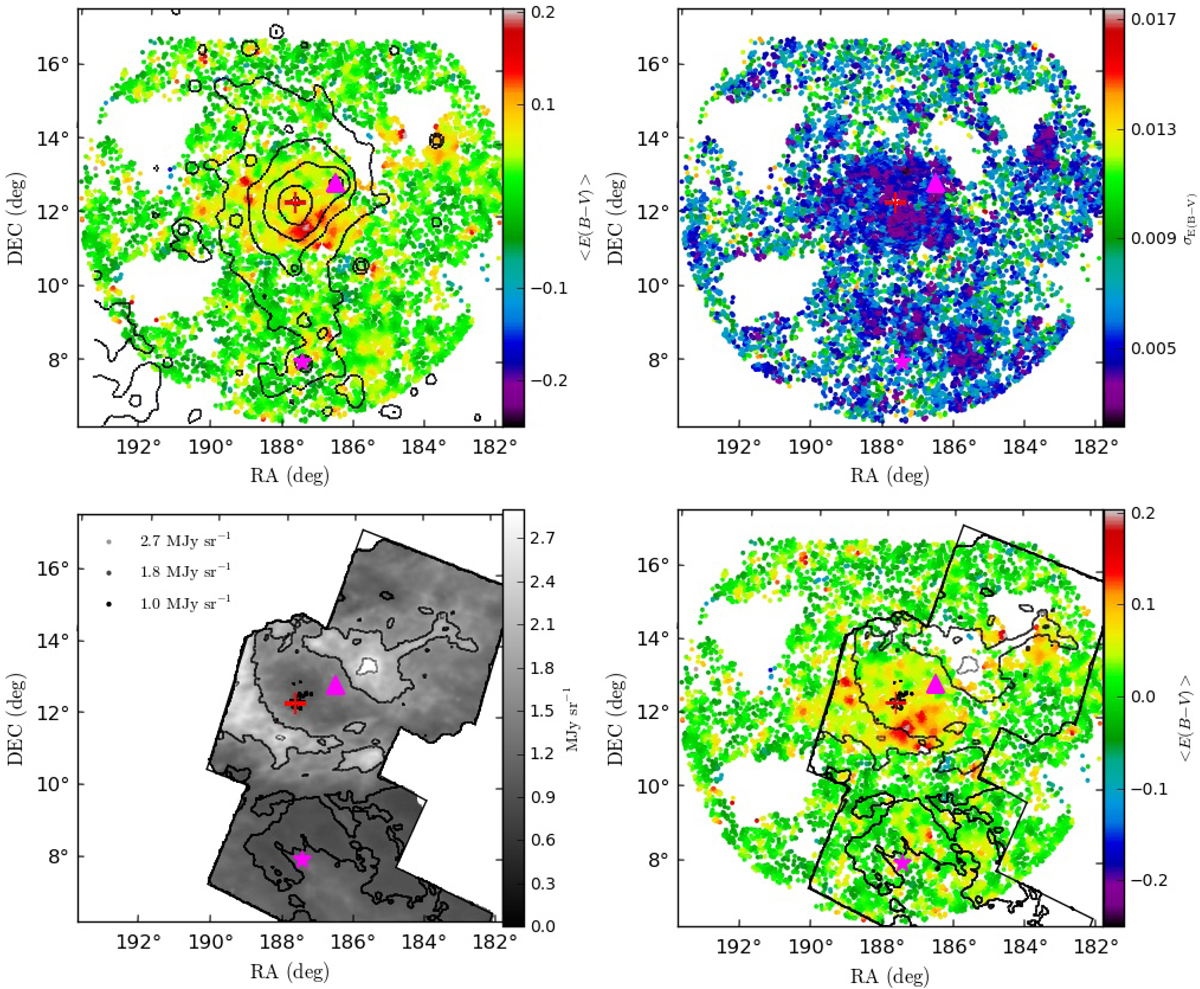
Top left panel: spatial distribution of the background galaxies, colour-coded according to the cluster E(B − V) means. The peak measured south-west of M87 (red cross) is caused by background clusters. Black contours trace the cluster X-ray emission (Böhringer et al. 1994). Top right panel: errors in the reddening map computed by means of Monte Carlo simulations. Bottom left panel: model of the Galactic dust emission in the HeViCS fields in the SPIRE 250 μm band (Bianchi et al. 2017). Right panel: comparison between the Virgo dust reddening and different levels of Galactic contamination (see legend in the bottom left panel). In all panels, the red cross identifies the centre of the cluster, while the magenta star and triangle show the positions of M 49 and M 86, respectively.
Current usage metrics show cumulative count of Article Views (full-text article views including HTML views, PDF and ePub downloads, according to the available data) and Abstracts Views on Vision4Press platform.
Data correspond to usage on the plateform after 2015. The current usage metrics is available 48-96 hours after online publication and is updated daily on week days.
Initial download of the metrics may take a while.