Fig. 4.
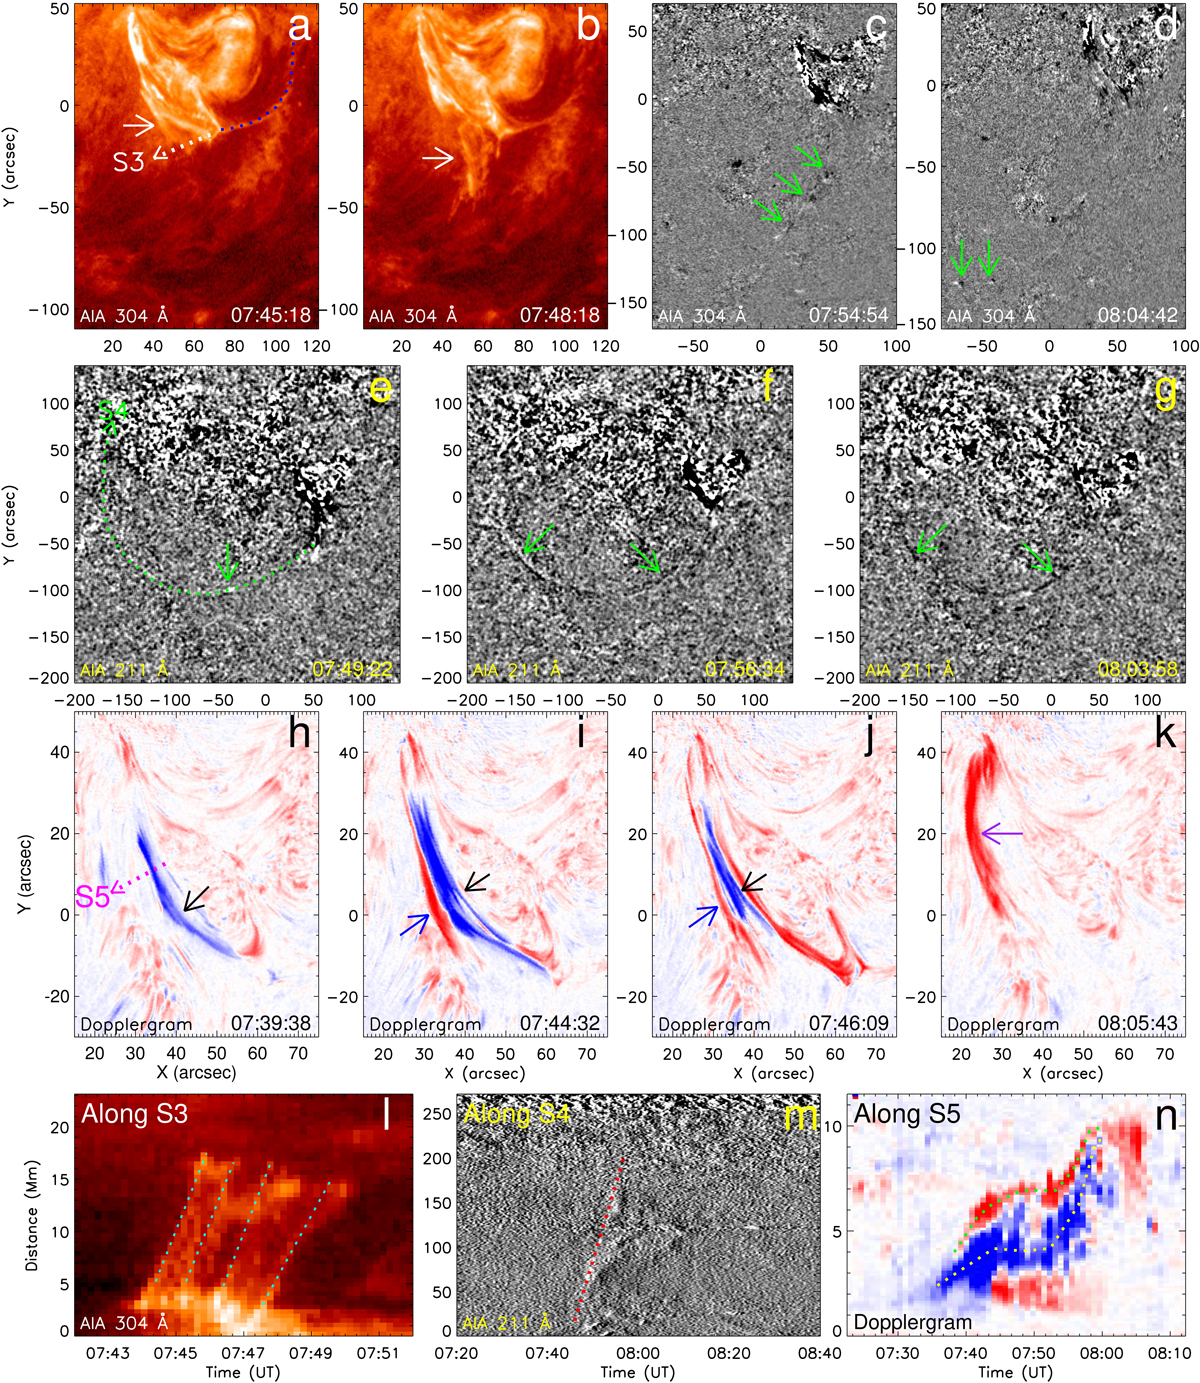
Jet shown in the AIA 304 Å original (panels a and b) and AIA 304 Å running-difference images (panels c and d), AIA 211 Å running-difference images (panels e–g), and in the Hα Dopplergrams (panels h–k). Three time-distance diagrams (panels l–n) were obtained along the slice S3 (the white line in panel a) using the AIA 304 Å images, along the slice S4 (the green line in panel e) using the AIA 211 Å running-difference images, and along the slice S5 (the pink line in the panel h) using the Hα Dopplergrams. The white arrows point to the newly formed loops. The jet is indicated by the green arrows, and its redshifted and blueshifted portions are marked by the blue and black arrows in panels h–j and green and yellow lines in panel n, respectively. The motions of the newly formed loops are indicated by the cyan lines in panel l, and the jet in panel m is indicated by the red line. The purple arrow points to the downward filament material. A movie associated to this figure is available online.
Current usage metrics show cumulative count of Article Views (full-text article views including HTML views, PDF and ePub downloads, according to the available data) and Abstracts Views on Vision4Press platform.
Data correspond to usage on the plateform after 2015. The current usage metrics is available 48-96 hours after online publication and is updated daily on week days.
Initial download of the metrics may take a while.