Fig. 1.
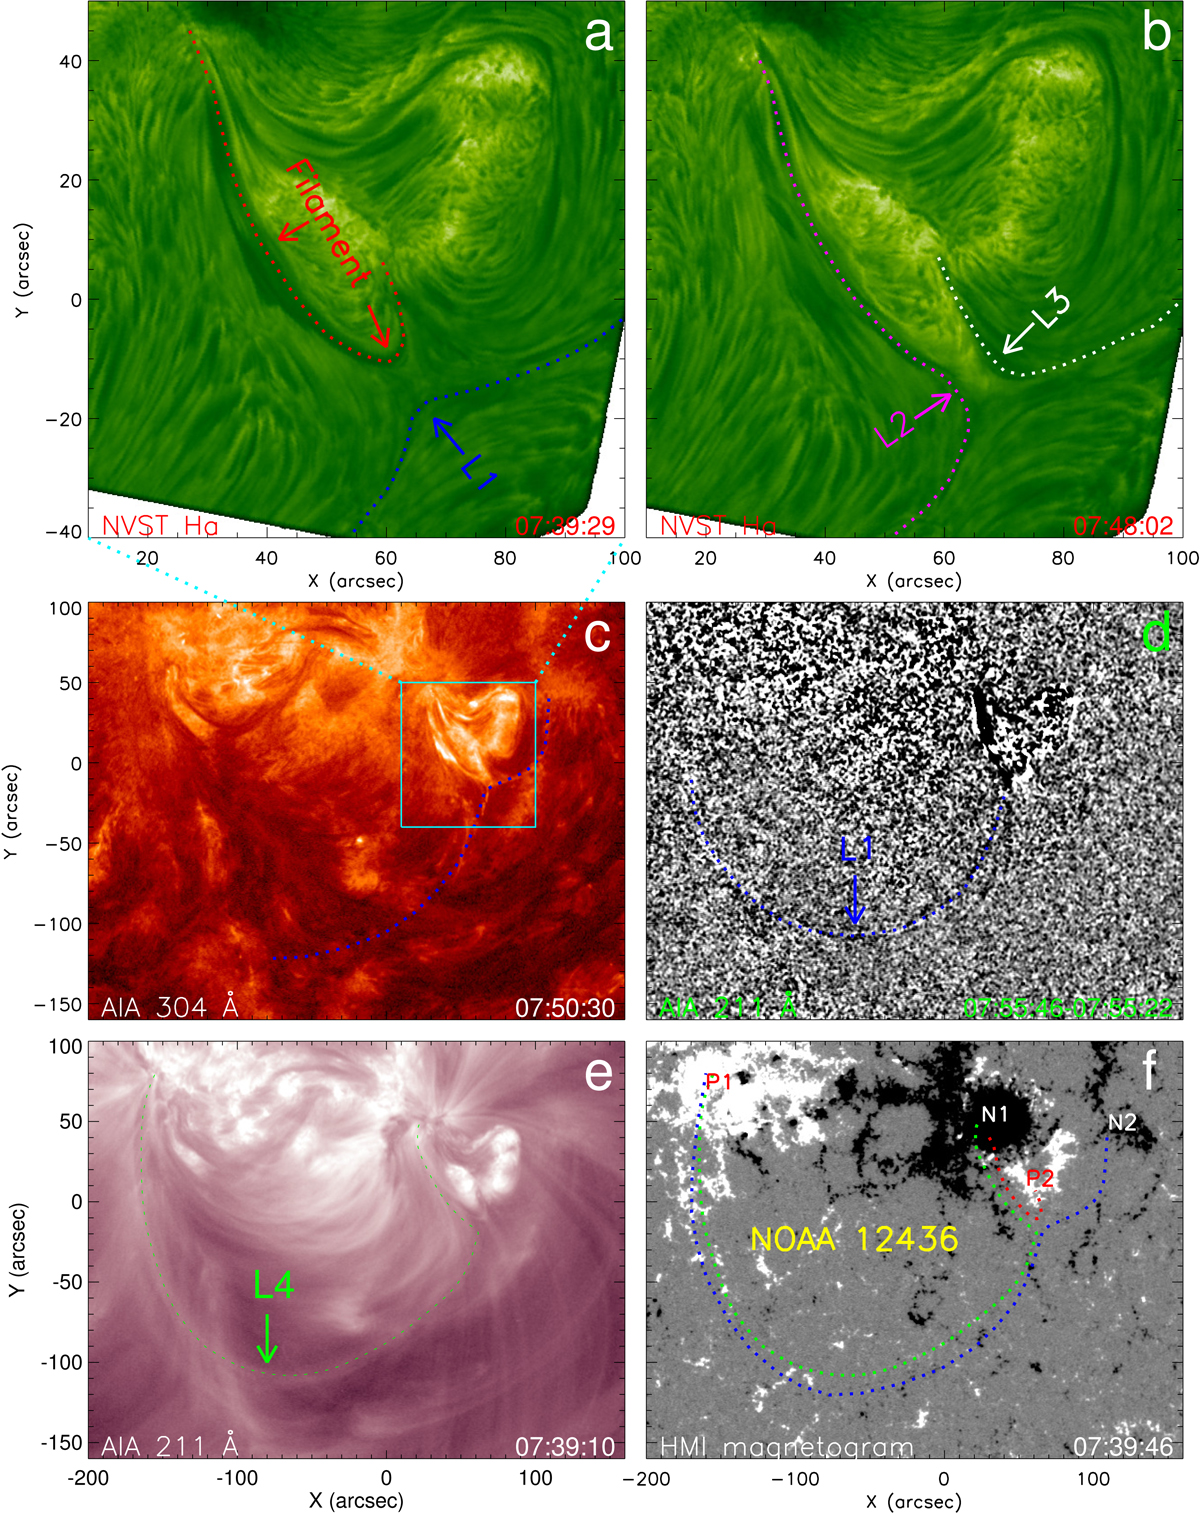
Overview of magnetic reconnection in the NVST Hα (panels a and b), AIA 304 Å, 211 Å running-difference and 211 Å original images (panels c–e), and HMI magnetogram (panel f). The filament is marked by the red dotted lines and arrows. L1 and L4 are indicated by the blue and green dotted lines and arrows. The newly formed magnetic loops (L2 and L3) after the reconnection are marked by the pink and white dotted lines and arrows. Four magnetic polarities associated with the reconnecting loops are denoted as P1, P2, N1, and N2 (panel f).
Current usage metrics show cumulative count of Article Views (full-text article views including HTML views, PDF and ePub downloads, according to the available data) and Abstracts Views on Vision4Press platform.
Data correspond to usage on the plateform after 2015. The current usage metrics is available 48-96 hours after online publication and is updated daily on week days.
Initial download of the metrics may take a while.