Fig. 9
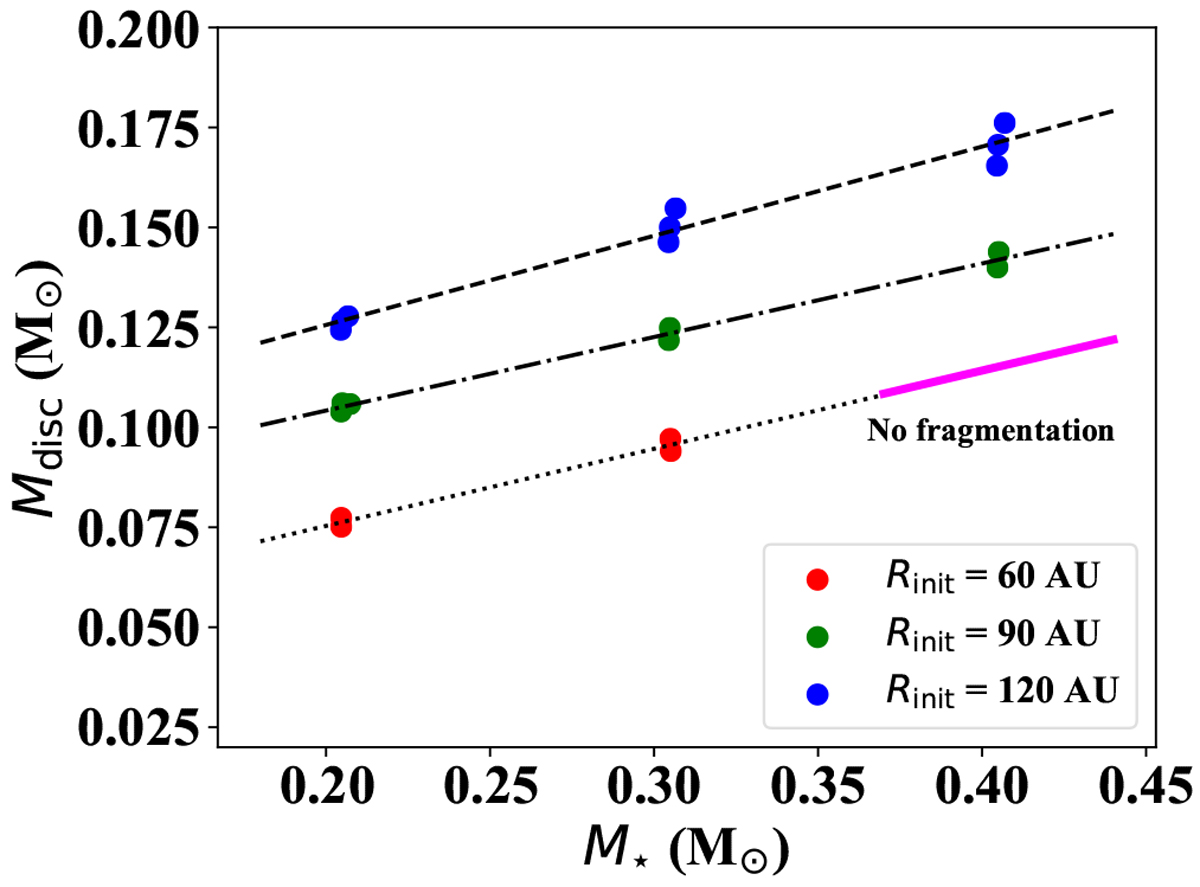
Disc mass as a function of stellar mass when the disc fragments. Different colours correspond to different initial disc radii (as marked on the graph). The relationship between the two quantities is linear for a given initial disc radius. Smaller discs fragment at a lower mass, as the average disc surface density is larger. The different lines correspond to the linear relations derived for simulations with the same initial disc radius (see text). The purple line corresponds to the area in the parameter space where no fragmentation occurs (small discs around more massive M dwarfs).
Current usage metrics show cumulative count of Article Views (full-text article views including HTML views, PDF and ePub downloads, according to the available data) and Abstracts Views on Vision4Press platform.
Data correspond to usage on the plateform after 2015. The current usage metrics is available 48-96 hours after online publication and is updated daily on week days.
Initial download of the metrics may take a while.