Fig. 24
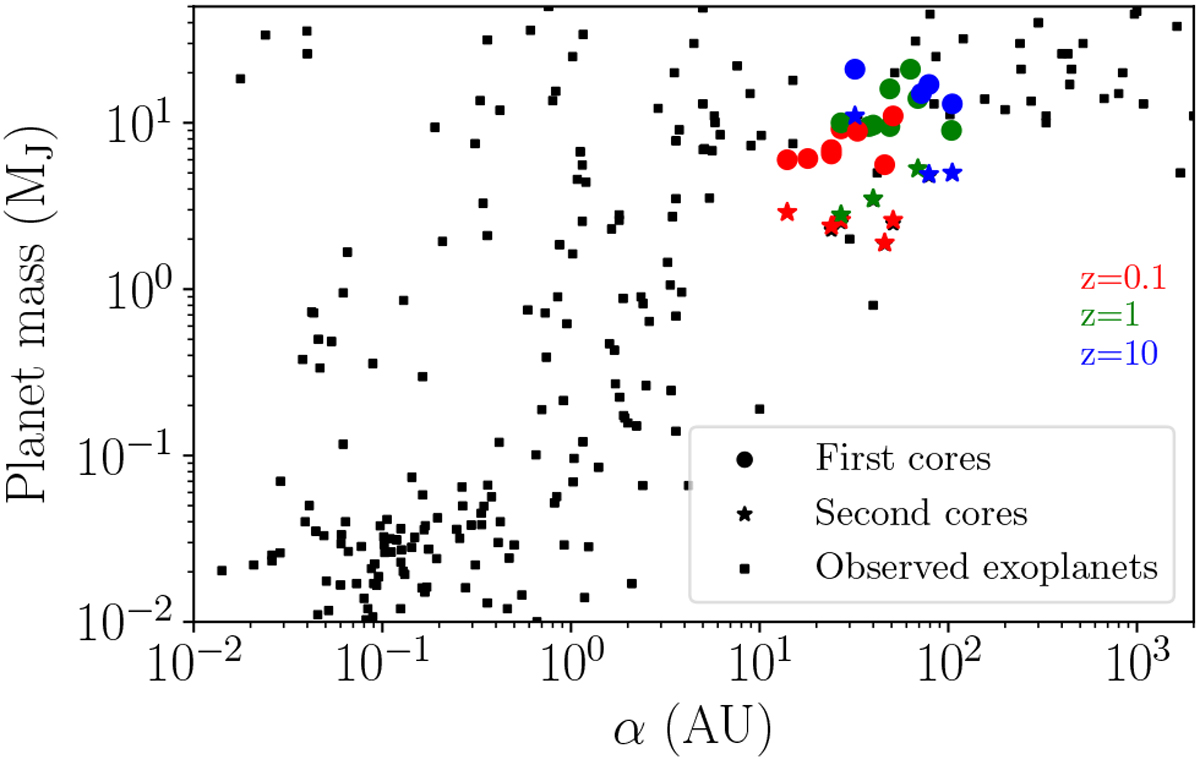
Masses (Mp sin(i), where i is the planet orbit orientation) of planets around M dwarfs (M⋆ < 0.5M⊙) as a function of their semi-major axis. Black points correspond to the observed exoplanets. The coloured symbols correspond to the protoplanets formed in the simulations presented here. Circles correspond to first cores, whereas stars to the second cores. Colours correspond to different opacities (red: z = 0.1, green: z = 1, blue: z = 10). As these protoplanets are still embedded within their protostellar discs, they may migrate inwards or outwards, changing their final semi-major axis. Similarly, they may undergo gas accretion or tidal stripping, changing their final mass.
Current usage metrics show cumulative count of Article Views (full-text article views including HTML views, PDF and ePub downloads, according to the available data) and Abstracts Views on Vision4Press platform.
Data correspond to usage on the plateform after 2015. The current usage metrics is available 48-96 hours after online publication and is updated daily on week days.
Initial download of the metrics may take a while.