Fig. 15
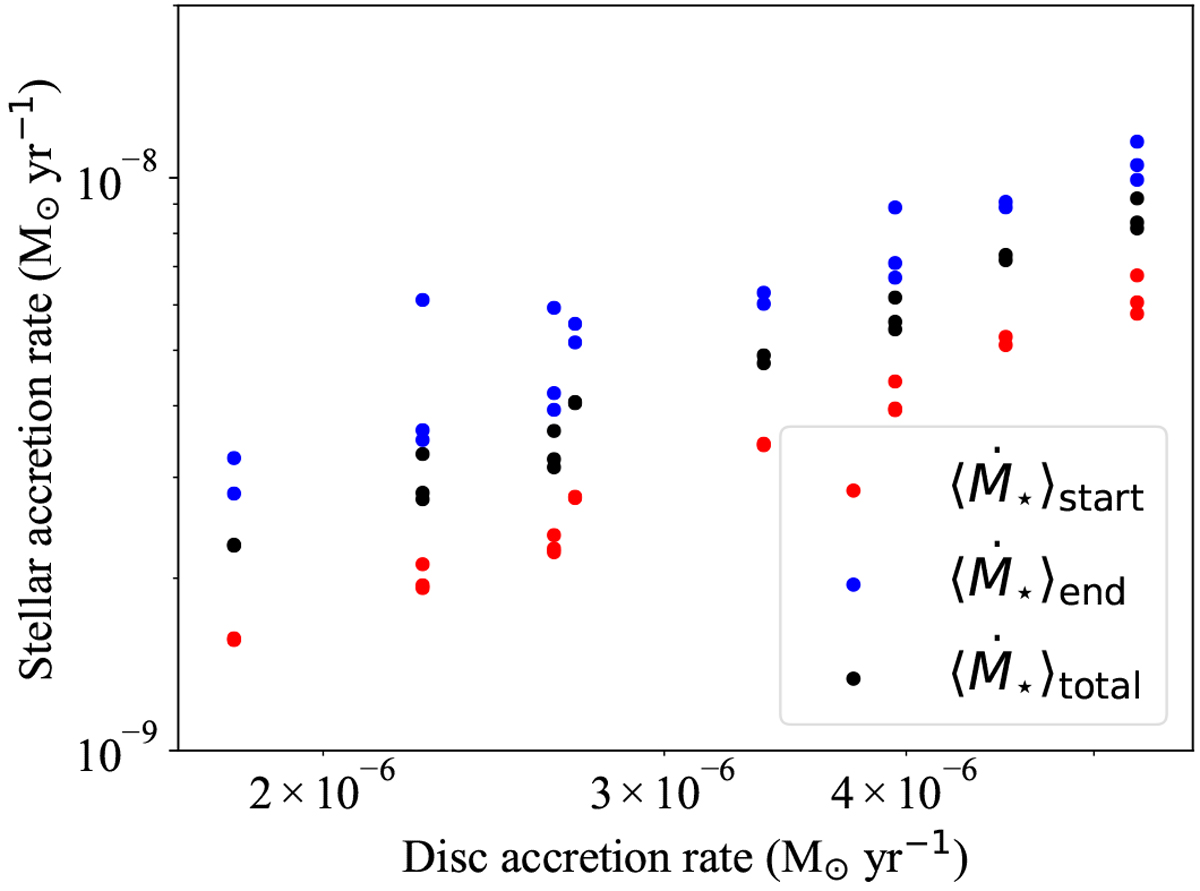
Relationship between the accretion rate onto the disc (Eq. (5)) and the accretion rate onto the central star. The black points show the average accretion for the entire simulation, whereas the red and blue points the average stellar rate during the first and last 10% of the simulated time, respectively.
Current usage metrics show cumulative count of Article Views (full-text article views including HTML views, PDF and ePub downloads, according to the available data) and Abstracts Views on Vision4Press platform.
Data correspond to usage on the plateform after 2015. The current usage metrics is available 48-96 hours after online publication and is updated daily on week days.
Initial download of the metrics may take a while.