Fig. 11
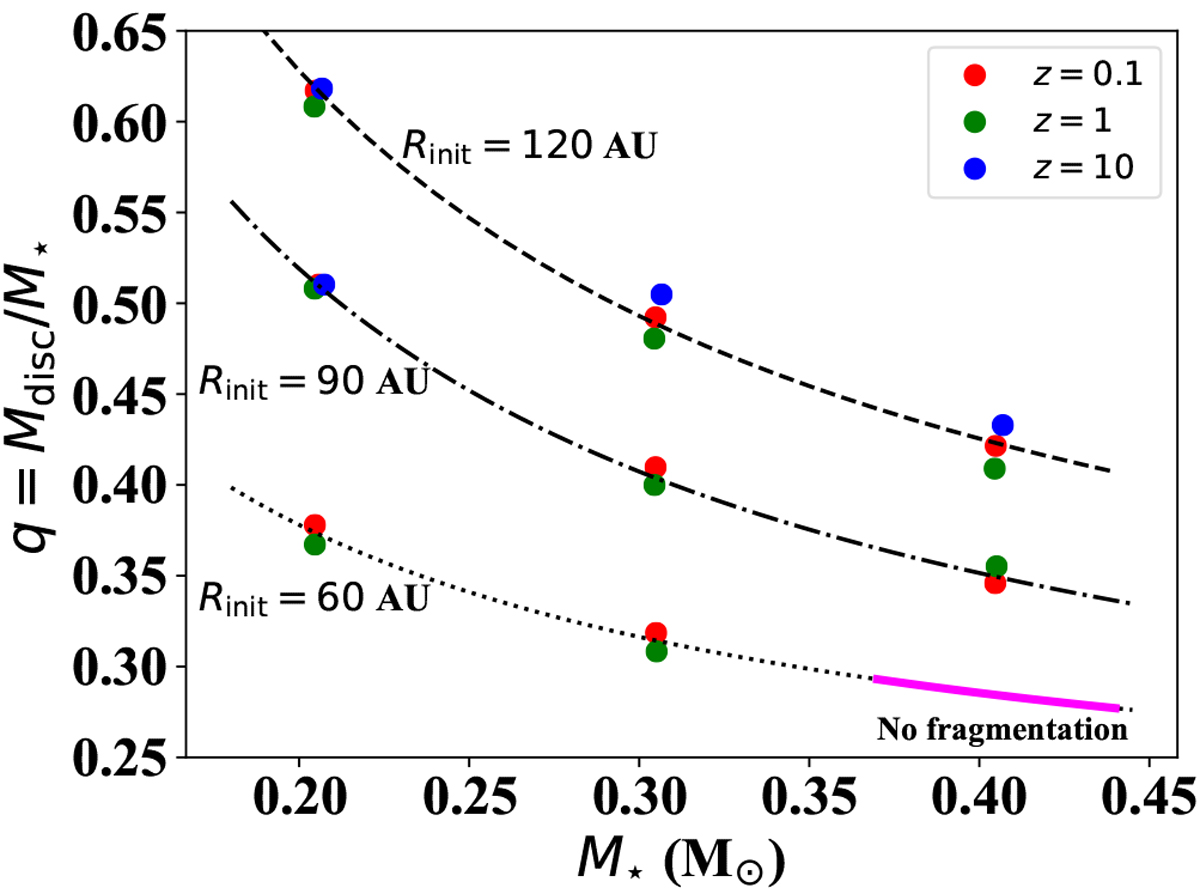
Disc-to-star mass ratio, q, at the time of disc fragmentation as a function of stellar mass for metallicities z = [0.1, 1, 10] marked by the red, green and blue points, respectively. Each group of points (3 or 2 points) correspond to simulations of different metallicity discs (that have the same initial radius) around the stars with the same mass. We note that discs (with the same initial extent) around more massive stars fragment at a lower disc-to-star mass ratio. The disc-to-star mass ratio required for fragmentation varies from ~0.3 (for small discs) to ~0.6 (for more extended discs). The different lines correspond to the hyperbolic relations derived for simulations with the same initial disc radius. The purple line corresponds to the area in the parameter space where no fragmentation occurs (small discs around more massive M dwarfs).
Current usage metrics show cumulative count of Article Views (full-text article views including HTML views, PDF and ePub downloads, according to the available data) and Abstracts Views on Vision4Press platform.
Data correspond to usage on the plateform after 2015. The current usage metrics is available 48-96 hours after online publication and is updated daily on week days.
Initial download of the metrics may take a while.