Fig. 8
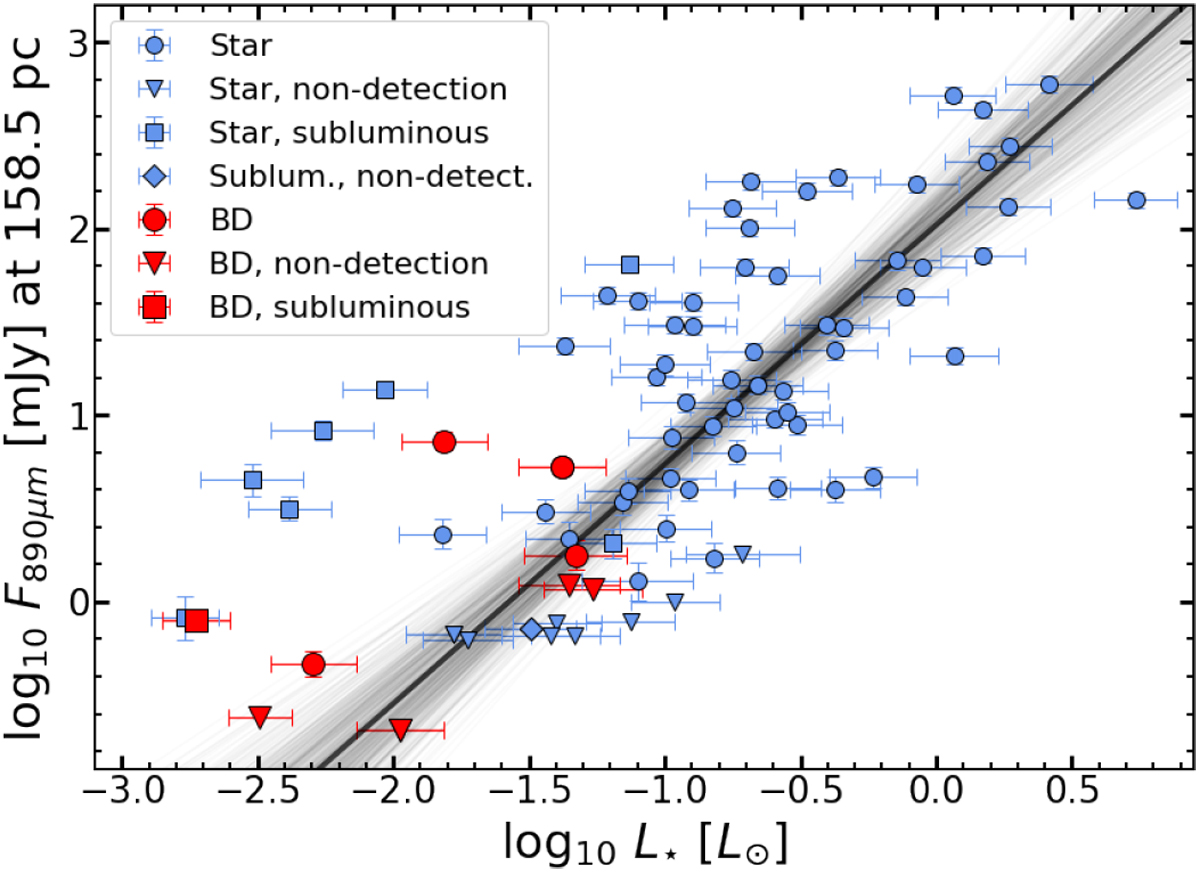
890 μm fluxes vs. stellar luminosity for the Lupus population. Stellar population is shown in blue; the BD disk population is plotted in red. Detected sources from ALMA observations are represented as circles; upper limits of nondetections are shown as triangles; subluminous objects as inferred from X-shooter spectra are plotted as squares. The linear regression shown has been obtained from the entire population, excluding subluminous sources.
Current usage metrics show cumulative count of Article Views (full-text article views including HTML views, PDF and ePub downloads, according to the available data) and Abstracts Views on Vision4Press platform.
Data correspond to usage on the plateform after 2015. The current usage metrics is available 48-96 hours after online publication and is updated daily on week days.
Initial download of the metrics may take a while.