Fig. 7
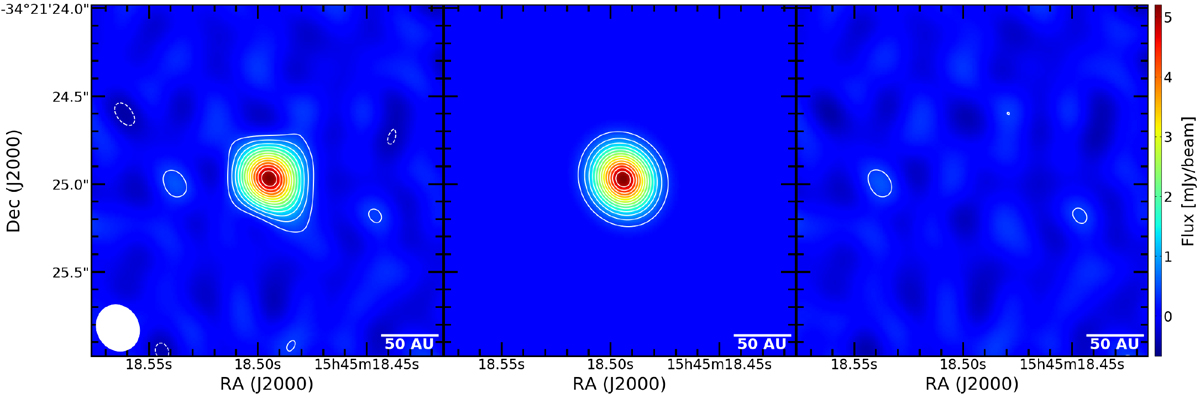
Observed (left), model (center), and respective (right panel) residuals for the continuum emission of J154518.5-342125 observed with ALMA. The modeled emission map is reconstructed from the synthetic visibilities with the lowest χ2 from the interferometric modeling. The contours are drawn at increasing (or decreasing) 3σ intervals as solid (dashed) lines.
Current usage metrics show cumulative count of Article Views (full-text article views including HTML views, PDF and ePub downloads, according to the available data) and Abstracts Views on Vision4Press platform.
Data correspond to usage on the plateform after 2015. The current usage metrics is available 48-96 hours after online publication and is updated daily on week days.
Initial download of the metrics may take a while.