Fig. 5
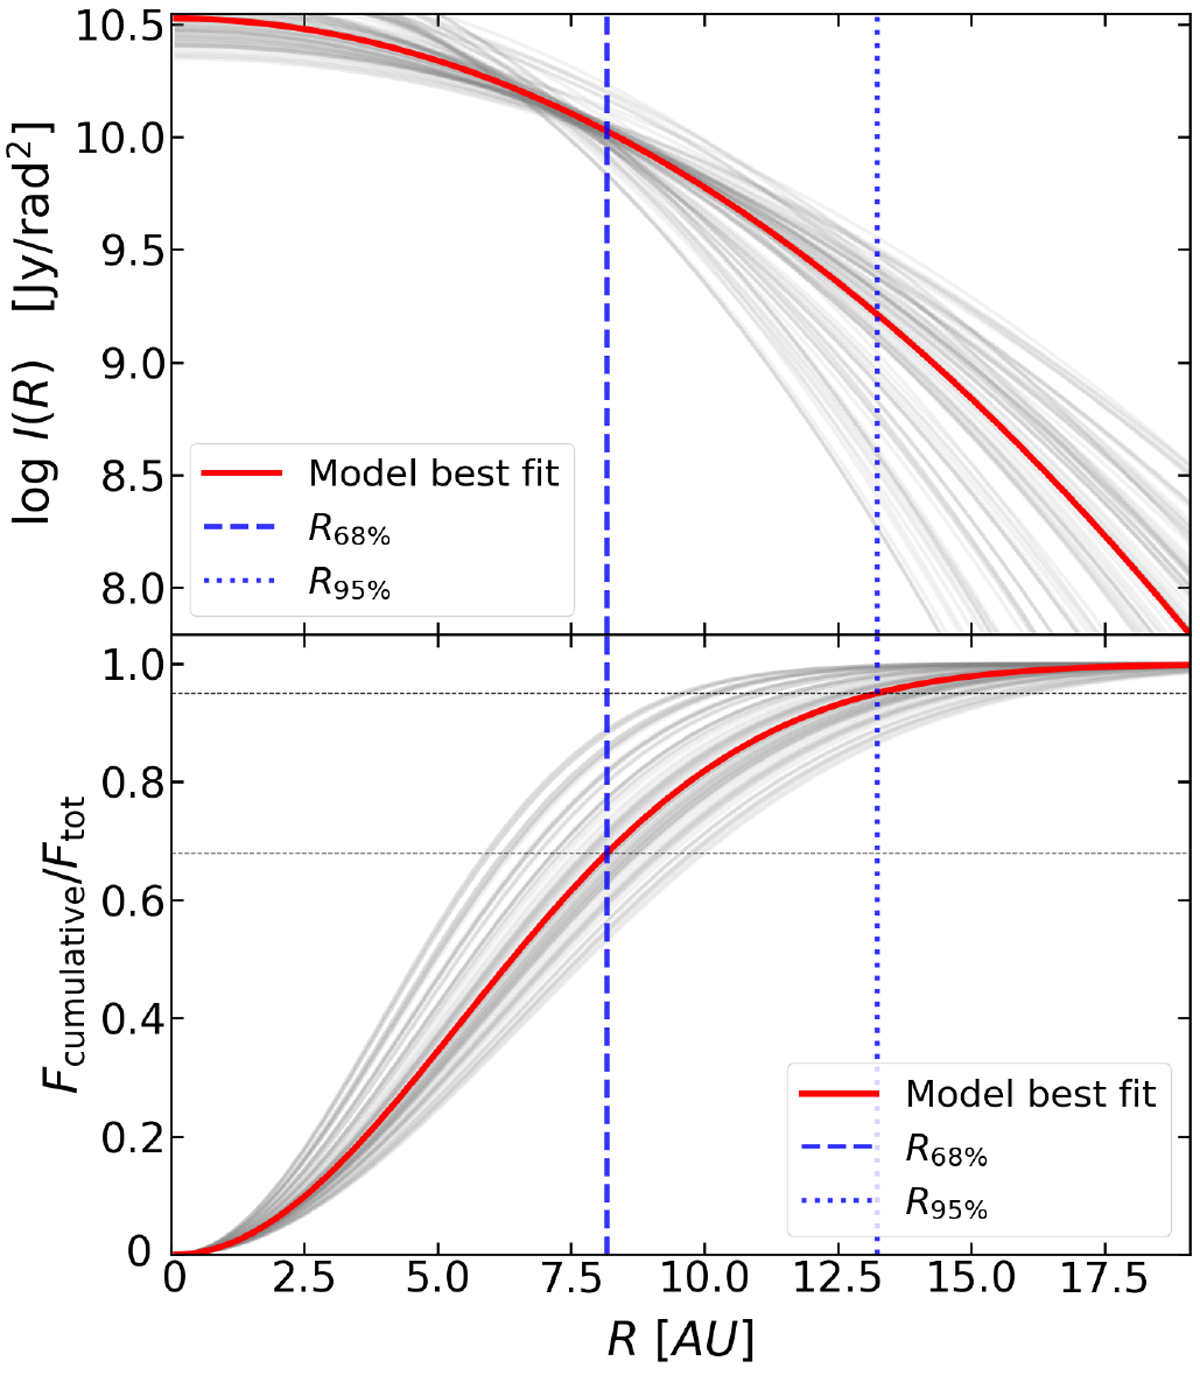
Radial brightness profile (top panel) and the associated cumulative flux (bottom) for the disk of J154518.5-342125 resulting from the Gaussian model used to fit the observed visibilities. The lowest χ2 model and arandom subset of models are drawn in both panels as a red and thin gray curves respectively.
Current usage metrics show cumulative count of Article Views (full-text article views including HTML views, PDF and ePub downloads, according to the available data) and Abstracts Views on Vision4Press platform.
Data correspond to usage on the plateform after 2015. The current usage metrics is available 48-96 hours after online publication and is updated daily on week days.
Initial download of the metrics may take a while.