Fig. 1
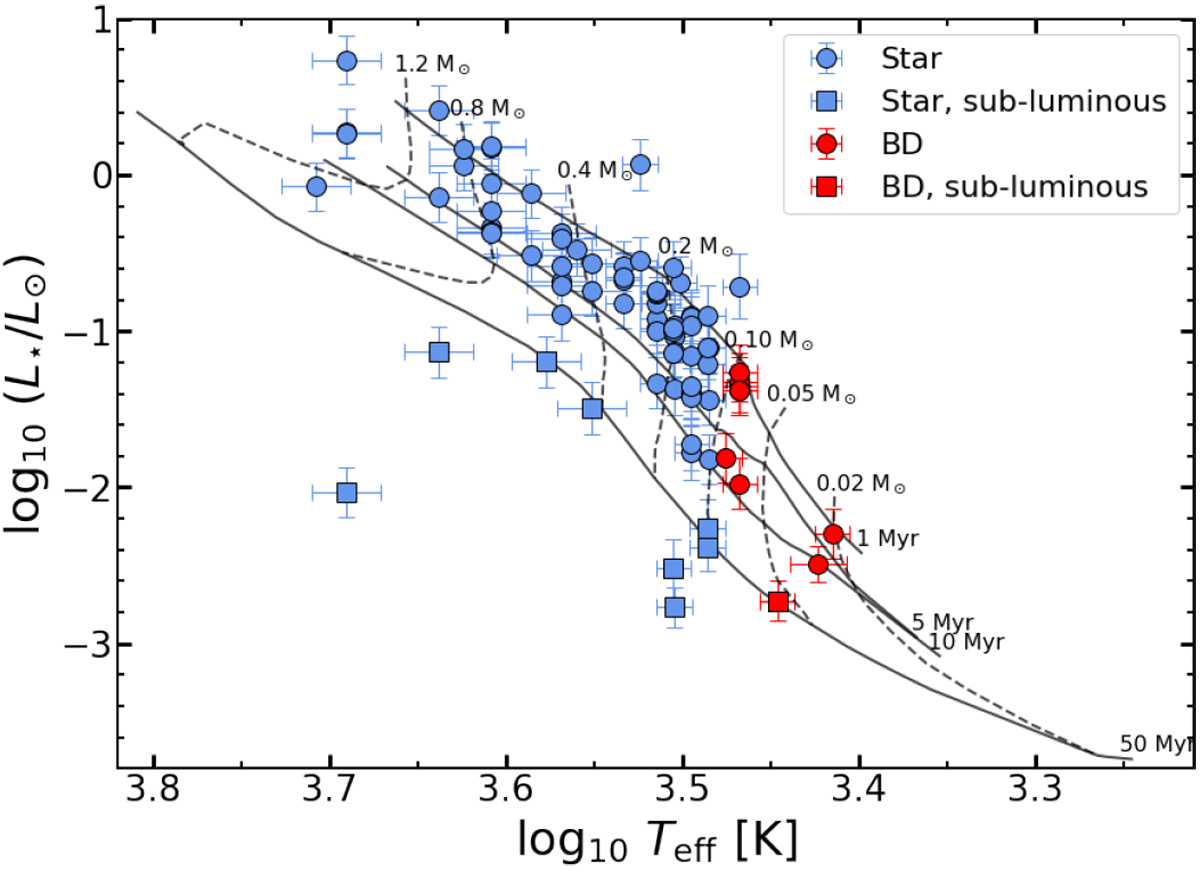
Hertzsprung–Russell diagram for the studied BD and stellar populations from Lupus. The stellar luminosity is taken from the literature and re-adjusted to the new distance associated to the parallaxes from Gaia DR2 (Gaia Collaboration 2018). The BD population is shown in red, and the stellar population is indicated in blue. The pre-MS tracks of Baraffe et al. (2015) are overlaid in the figure. Objects with luminosities that would correspond to older ages than expected are considered subluminous and marked as squares. A number of points lay on top of each other (e.g., 4 BDs near the 1 Myr and the 0.1 M⊙ lines.)
Current usage metrics show cumulative count of Article Views (full-text article views including HTML views, PDF and ePub downloads, according to the available data) and Abstracts Views on Vision4Press platform.
Data correspond to usage on the plateform after 2015. The current usage metrics is available 48-96 hours after online publication and is updated daily on week days.
Initial download of the metrics may take a while.