Fig. B.1
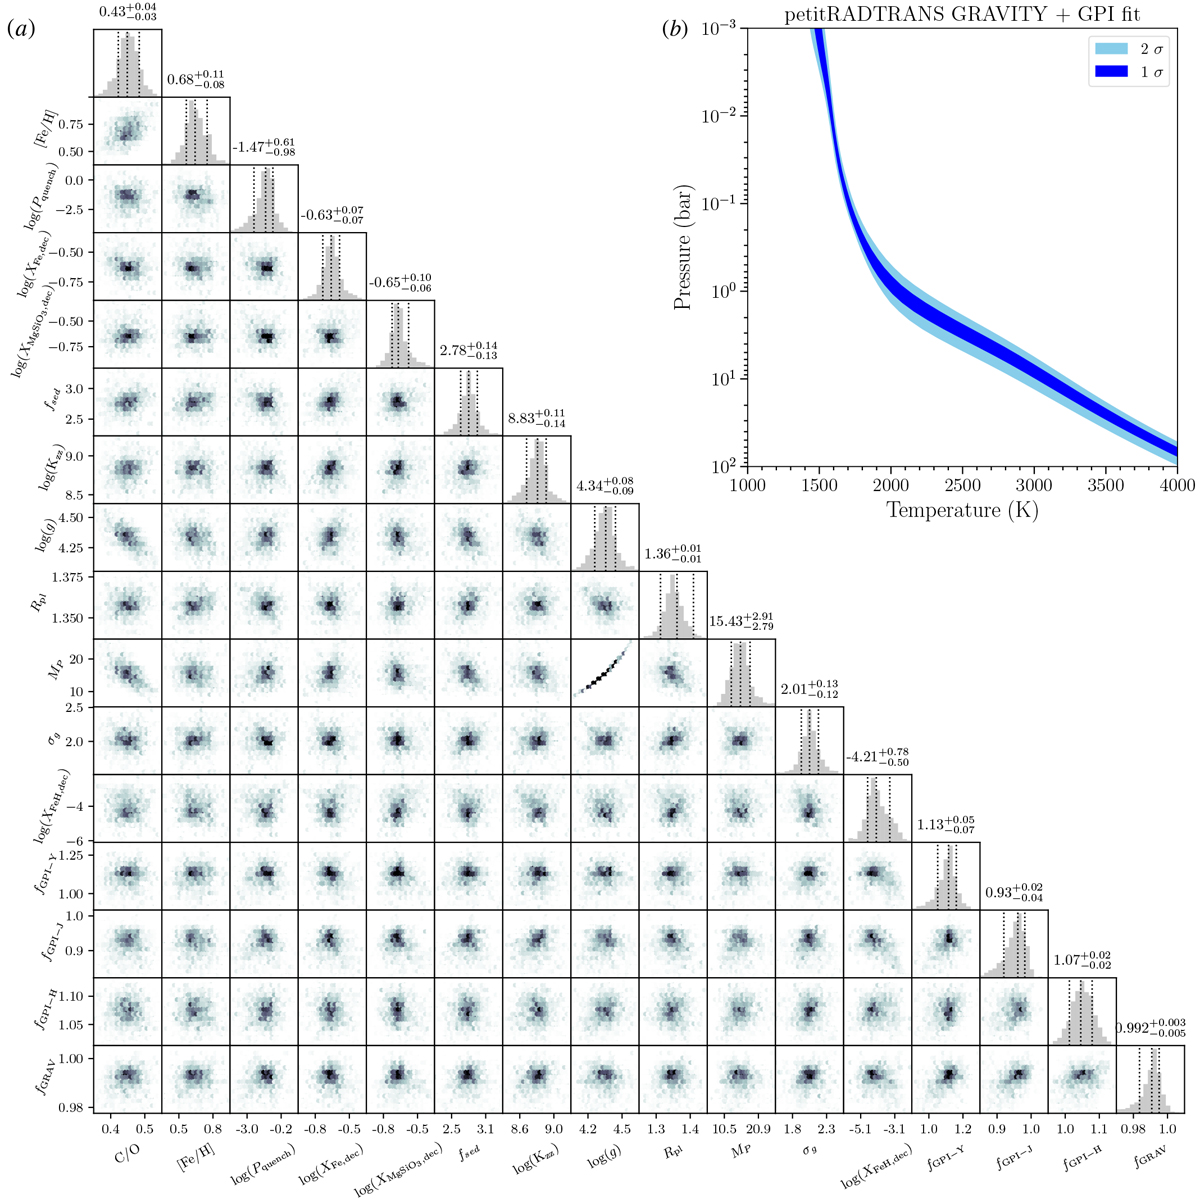
Panel a: projected 2-d posterior of the GRAVITY+GPI fit with petitRADTRANS (spectrum shown in Fig. 5), described in Sect. 4.3. See the text in Appendix B for a description of the parameters. Panel b: pressure-temperature envelopes obtained for the same retrieval. At every pressure, we plot the 16 to 84-percentile envelopes in dark blue, and the 2.5 to 97.5 percentile envelopes in light blue. If the temperature values were following a Gauss distribution, this would correspond to the 1 and 2 σ envelopes, respectively.
Current usage metrics show cumulative count of Article Views (full-text article views including HTML views, PDF and ePub downloads, according to the available data) and Abstracts Views on Vision4Press platform.
Data correspond to usage on the plateform after 2015. The current usage metrics is available 48-96 hours after online publication and is updated daily on week days.
Initial download of the metrics may take a while.