Fig. 8
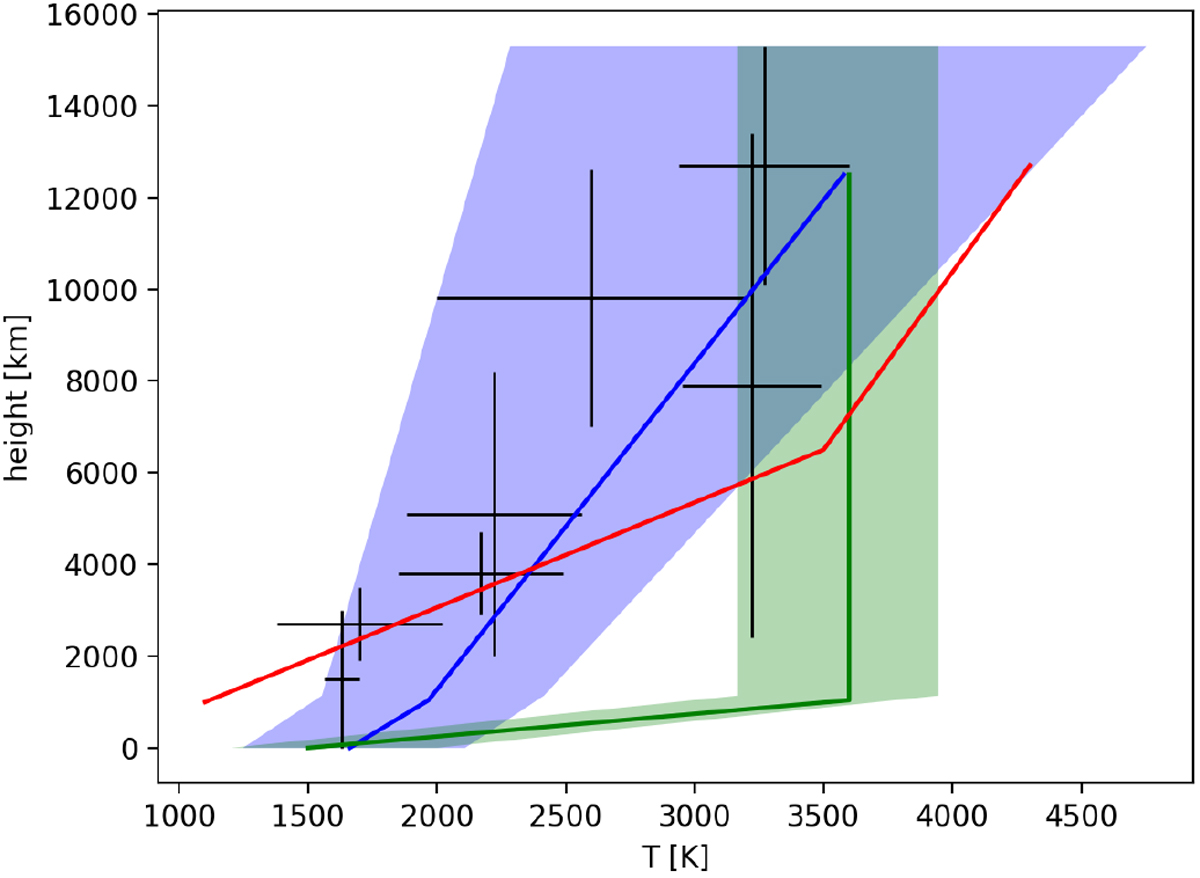
Temperature pressure profiles for HD 189733b. The points with error bars in black are from Wyttenbach et al. (2015), the red line corresponds to the profile from Huang et al. (2017) and the green and blue lines are the isothermal (see Figs. B.2 and B.1) and temperature gradient models (see Figs. B.5 and B.4) from this work. The shaded area corresponds to the 1σ area of the posterior distribution. The lowest data point in height comes from the continuum retrieval, the rest of the curve from the line cores.
Current usage metrics show cumulative count of Article Views (full-text article views including HTML views, PDF and ePub downloads, according to the available data) and Abstracts Views on Vision4Press platform.
Data correspond to usage on the plateform after 2015. The current usage metrics is available 48-96 hours after online publication and is updated daily on week days.
Initial download of the metrics may take a while.