Fig. 10
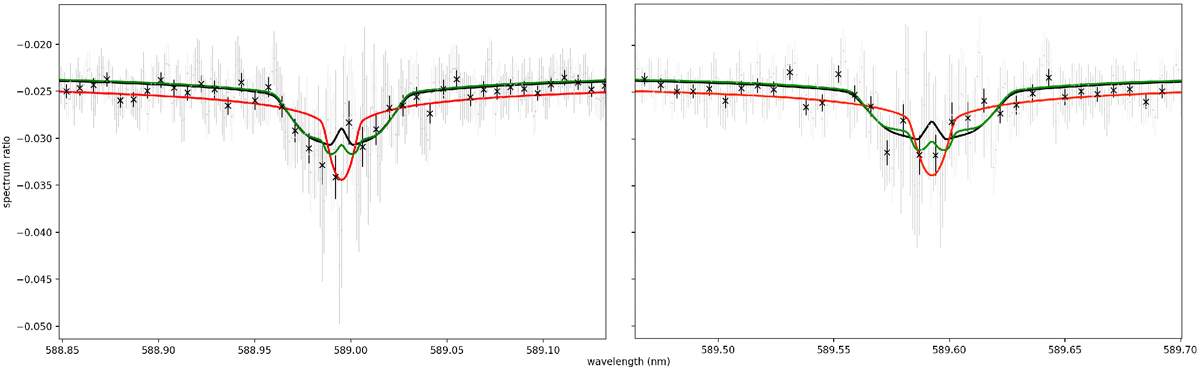
Spectral ratio of the hot Jupiter HD 189733b for the sodium D2 and D1 line. In grey, the data obtained with the HARPS spectrograph at the ESO 3.6 m telescope; in black, the binned data for visibility. The red line shows the isothermal base model, compatible with findings from Wyttenbach et al. (2015), and the black line the best-fit with super-rotation in the lower atmosphere and vertical winds in the upper atmosphere. The green line shows the equally good fit of the model with no wind for pressures higher than h = −6 and solely vertical winds farther up in the atmosphere. The “bump” for both the black and green fits stems from the parts of the atmosphere where the LOS is orthogonal to the wind direction and the profile is not Doppler shifted. The parameters used to generate the fits are indicated as the blue lines (best-fit) in Figs. B.1, B.14. and B.16, respectively.
Current usage metrics show cumulative count of Article Views (full-text article views including HTML views, PDF and ePub downloads, according to the available data) and Abstracts Views on Vision4Press platform.
Data correspond to usage on the plateform after 2015. The current usage metrics is available 48-96 hours after online publication and is updated daily on week days.
Initial download of the metrics may take a while.