Fig. 1
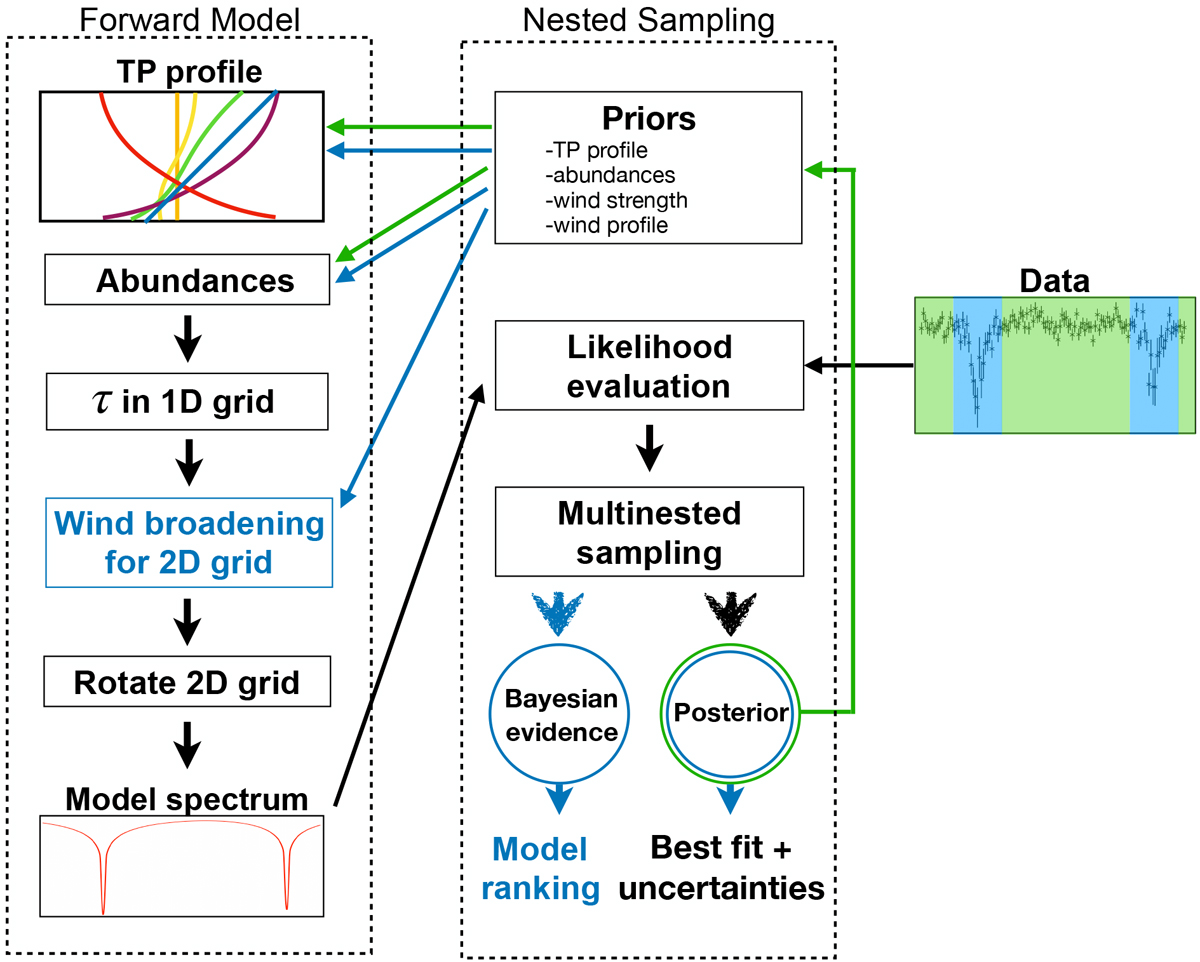
Flowchart showing the information flow from forward model to the nested sampling module and vice versa in MERC. Green arrows are executed during the continuum retrieval, blue arrows are only executed during the line retrieval. Starting with the retrieval windows in green from Fig. 6 and the parameters that can be retrieved onthe continuum (see Table 2), priors are set in the nested sampling module and handed to the forward model. One possible combination from the prior range is then used to calculate the extinction coefficient τ in a 1D grid in altitude above the planet surface. The planet surface is defined as the opaque part of the planet at the wavelength of the green region and is set at the optical white light radius. The 1D grid can be seen as a slice of the atmosphere, which is then used to create the full atmosphere (see Sect. 2.1) and calculate a model transmission spectrum. The model spectrum is handed back to the nested sampling module, where it is compared to the continuum of the data. The multi nested sampling executes this loop over the prior parameter space until the parameters converge to a value within the prior ranges. It then produces a posterior distribution of the prior and the Bayesian evidence of the model. The posterior of the continuum retrieval is then used to restrict the prior of the retrieval on the line retrieval window (shown in blue). The same process as for the continuum is started again, but now with additional wind broadening in each cell of the atmospheric slice. At the end, the Bayesian evidence of the line retrieval for each model is used to rank them. This flowchart was loosely inspired on a similar layout in Brogi & Line (2019).
Current usage metrics show cumulative count of Article Views (full-text article views including HTML views, PDF and ePub downloads, according to the available data) and Abstracts Views on Vision4Press platform.
Data correspond to usage on the plateform after 2015. The current usage metrics is available 48-96 hours after online publication and is updated daily on week days.
Initial download of the metrics may take a while.