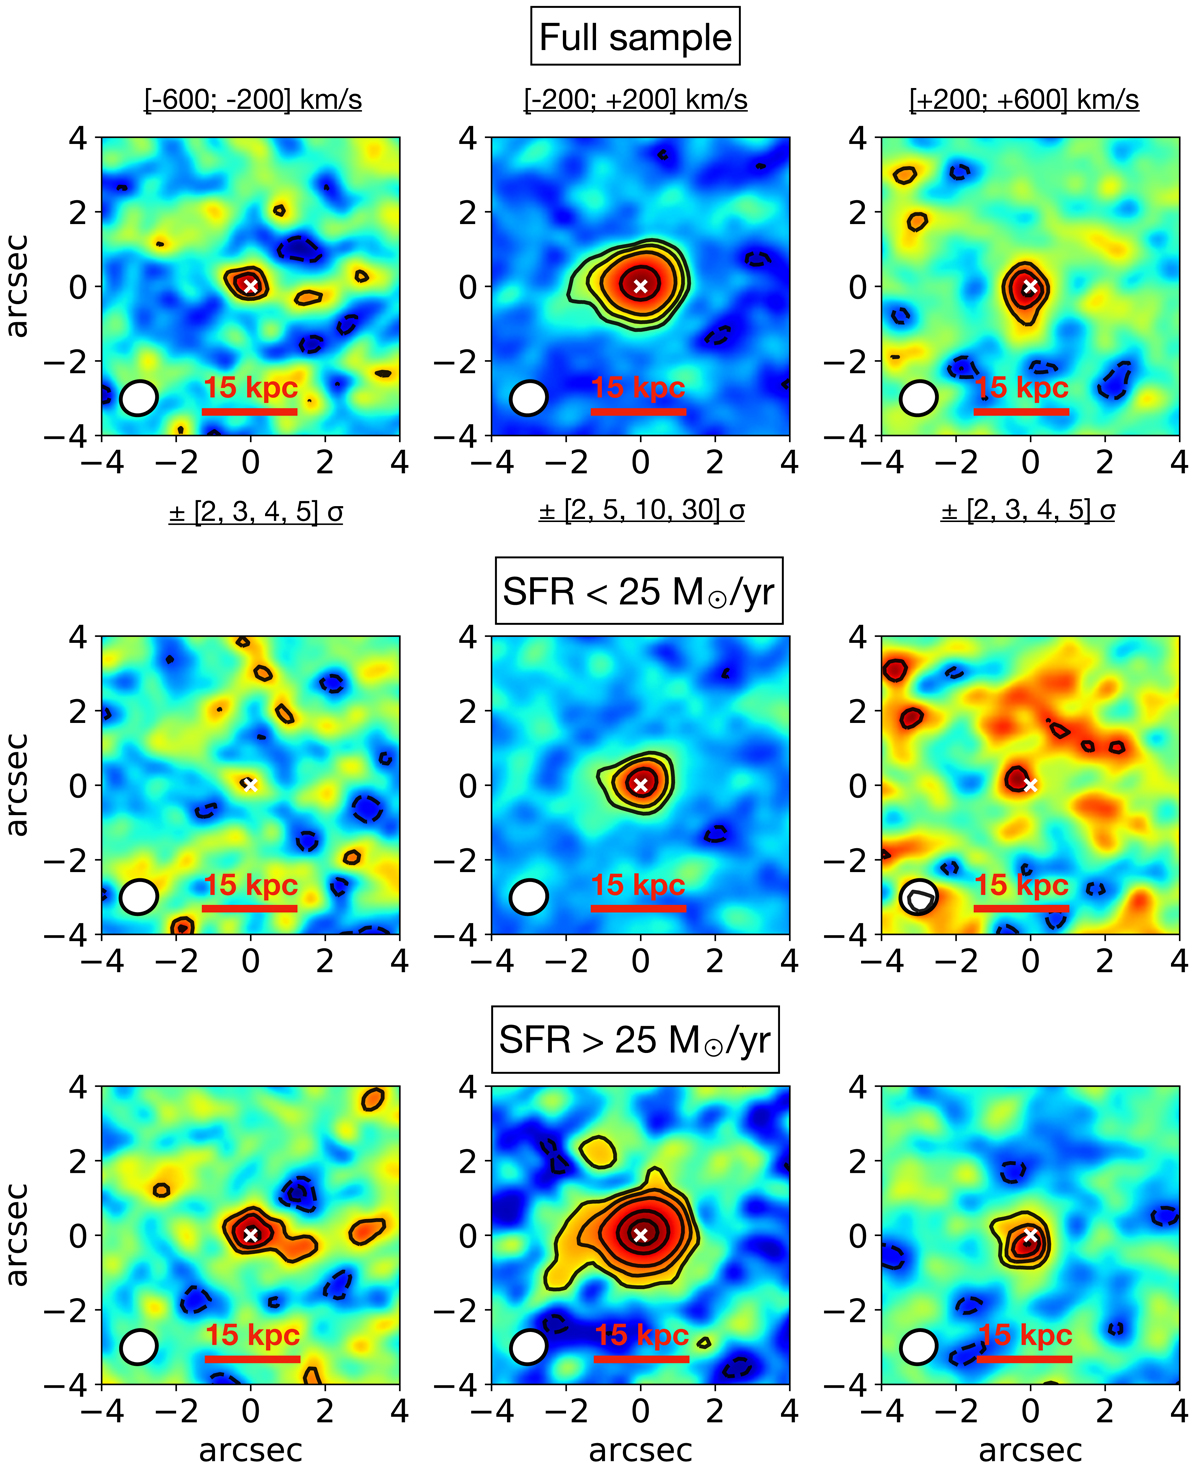
Fig. 9.
Circularly averaged radial profiles computed in concentric 0.3″-binned annuli are shown for (i) the stacked PSF of our ALMA observations (black solid line for galaxies in our sample, and black dashed line for ALPINE continuum-detected galaxies), (ii) the stacked FIR continuum of 23 ALPINE continuum-detected galaxies (mostly belonging to the high-SFR group, see text; orange squares), and (iii) the stacked maps of [C II] cores ([ − 200 : + 200] km s−1) for galaxies in the low-SFR (green squares) and high-SFR (blue square) groups. Error bars are indicative of the ±1σ dispersion of fluxes in each annulus, while the thin dashed lines represent the Poissonian noise associated with the radial profiles10.
Current usage metrics show cumulative count of Article Views (full-text article views including HTML views, PDF and ePub downloads, according to the available data) and Abstracts Views on Vision4Press platform.
Data correspond to usage on the plateform after 2015. The current usage metrics is available 48-96 hours after online publication and is updated daily on week days.
Initial download of the metrics may take a while.