Free Access
Fig. 6.
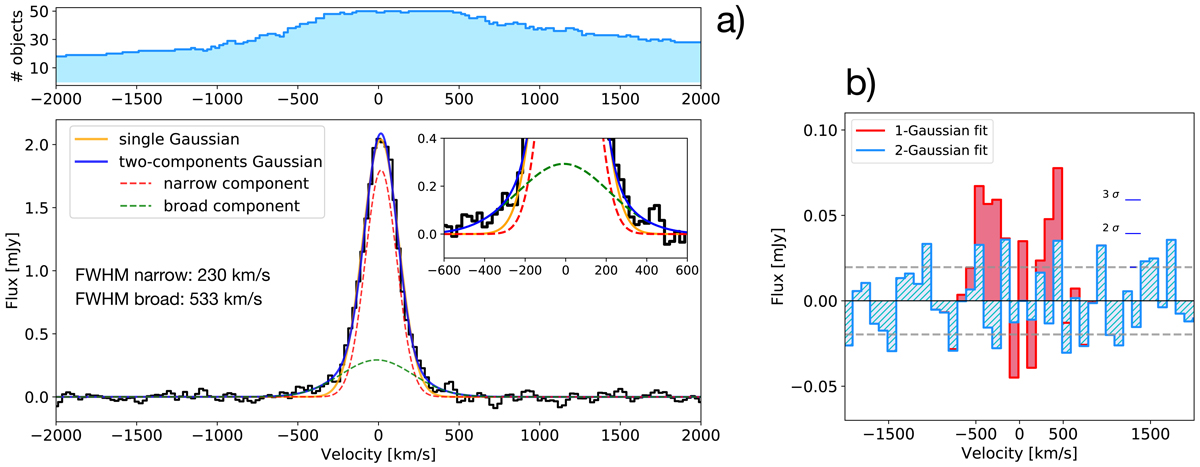
Same description as in Fig. 5. In this case the stacked [C II] spectrum and corresponding residuals from a single- and two-Gaussian best-fits are shown for the low-SFR (a), and the high-SFR (b) subsamples, individually.
Current usage metrics show cumulative count of Article Views (full-text article views including HTML views, PDF and ePub downloads, according to the available data) and Abstracts Views on Vision4Press platform.
Data correspond to usage on the plateform after 2015. The current usage metrics is available 48-96 hours after online publication and is updated daily on week days.
Initial download of the metrics may take a while.