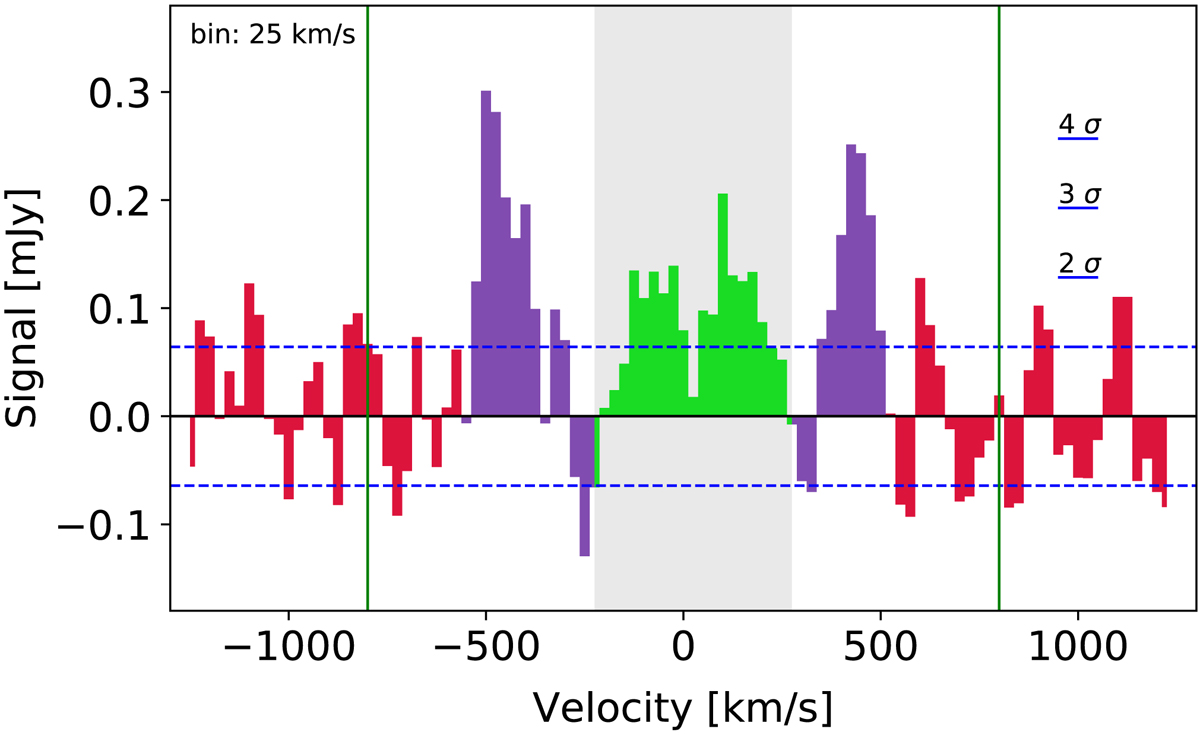
Fig. 5.

a: variance-weighted stacked [C II] spectrum of all galaxies in our sample is shown, in velocity bins of 25 km s−1. The orange (blue) line shows the single-Gaussian (two-Gaussian) best-fit. The red and the green line represent the narrow and broad components of the two-Gaussian model, respectively. A zoom of the velocity range [ − 600 : + 600] km s−1 is shown in the inset. A histogram containing the number of objects per channel contributing to the stacking is shown in the top panel. b: residuals from the single-Gaussian (two-Gaussian) best-fit are shown in red (blue), in velocity bins of 50 km s−1.
Current usage metrics show cumulative count of Article Views (full-text article views including HTML views, PDF and ePub downloads, according to the available data) and Abstracts Views on Vision4Press platform.
Data correspond to usage on the plateform after 2015. The current usage metrics is available 48-96 hours after online publication and is updated daily on week days.
Initial download of the metrics may take a while.


