Fig. 1.
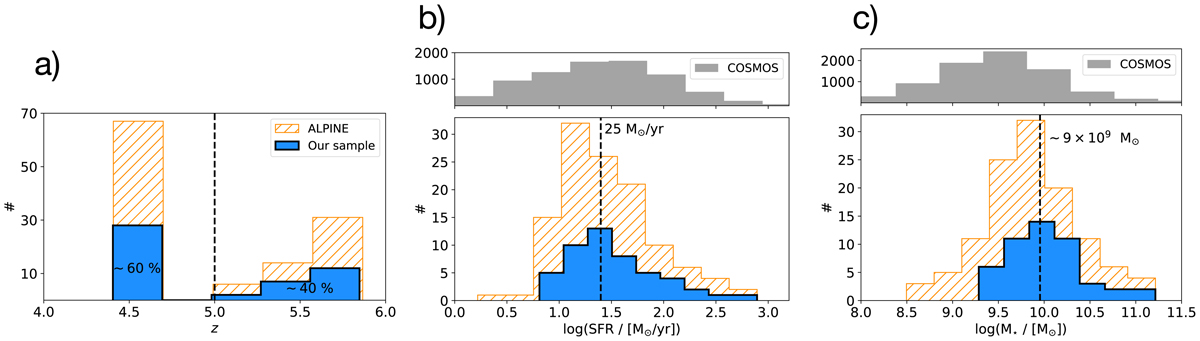
Redshift (a), SFR (b), and M⋆ (c) distributions of galaxies in the ALPINE survey (orange) and galaxies in our final sample (blue), drawn from ALPINE and used in this work (see Sect. 3.1.2). For comparison, in panels b and c we show the SFR and M⋆ distributions of all COSMOS galaxies with photometric redshift in the ALPINE range z = [4.4 − 5.8] (from Laigle et al. 2016). The gap in the redshift distribution is due to the original ALPINE sample selection, tailored to avoid a prominent atmospheric absorption at ∼325 GHz in ALMA band 7. The black dashed lines in panels b and c represent the median SFR and Mstar of galaxies in our ALPINE-drawn sample.
Current usage metrics show cumulative count of Article Views (full-text article views including HTML views, PDF and ePub downloads, according to the available data) and Abstracts Views on Vision4Press platform.
Data correspond to usage on the plateform after 2015. The current usage metrics is available 48-96 hours after online publication and is updated daily on week days.
Initial download of the metrics may take a while.